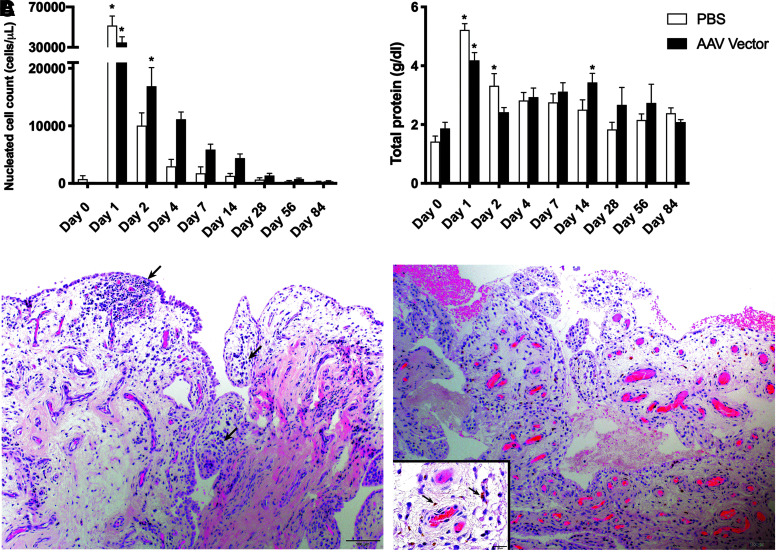
Figure 4.
(A) Nucleated cell count and (B) total protein concentration in synovial fluid over time. (C) H&E stained photomicrographs of equine synovium from PBS-injected (left panel) and AAV5-IL-10 injected (right panel) horses. Both samples comprise one to two layers of flattened to cuboidal synoviocytes supported by a loose fibromyxoid stroma with regularly interspersed blood vessels. Occasionally within the subintimal stroma are small aggregates of small lymphocytes and plasma cells (left, arrows) and scattered hemosiderin-laden macrophages (right, inset). * Significant difference from baseline, p < 0.05. H&E, hematoxylin and eosin; IL-10, interleukin-10; PBS, phosphate-buffered saline.

