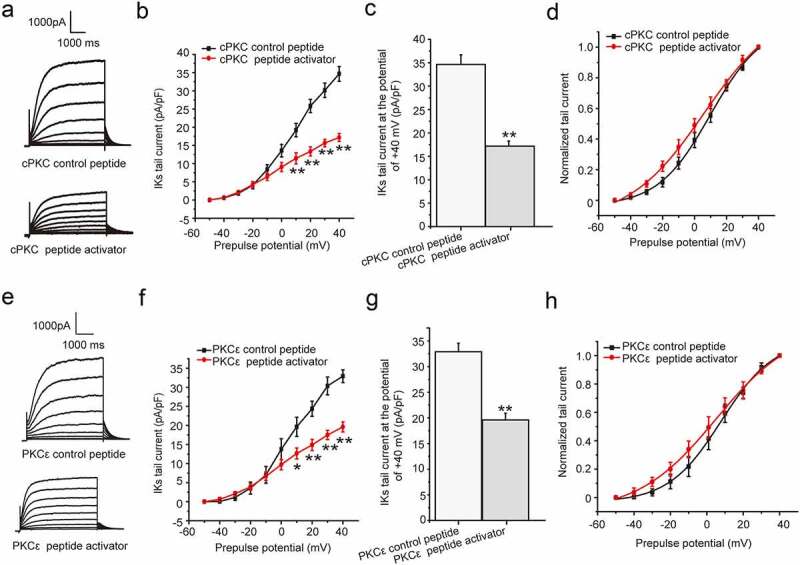
Figure 3.

The chronic effect cPKC and PKCε activation on IKs current in HEK 293B cell. (a) The representative IKs current under the cPKC activation (200 nM). (b) The current–voltage relationship for the IKs tail currents under the cPKC activation (200 nM). (c) The summary data for the tail currents under the cPKC activation (200 nM) at +40 mV prepulse. (d) The normalized I–V relationship for IKs tail currents. The solid lines represent fits to a Boltzmann function. (e) The representative IKs current under the PKCε activation (200 nM). (f) The current–voltage relationship for the IKs tail currents under the PKCε activation (200 nM). (g) The summary data for the IKs tail currents under the PKCε activation (200 nM) at +40 mV prepulse. (h) The normalized I–V relationship for IKs tail currents. The solid lines represent fits to a Boltzmann function. (**P < 0.01, compared with the cPKC or PKCε control peptide group; *P < 0.05, compared with the cPKC or PKCε control peptide group)
