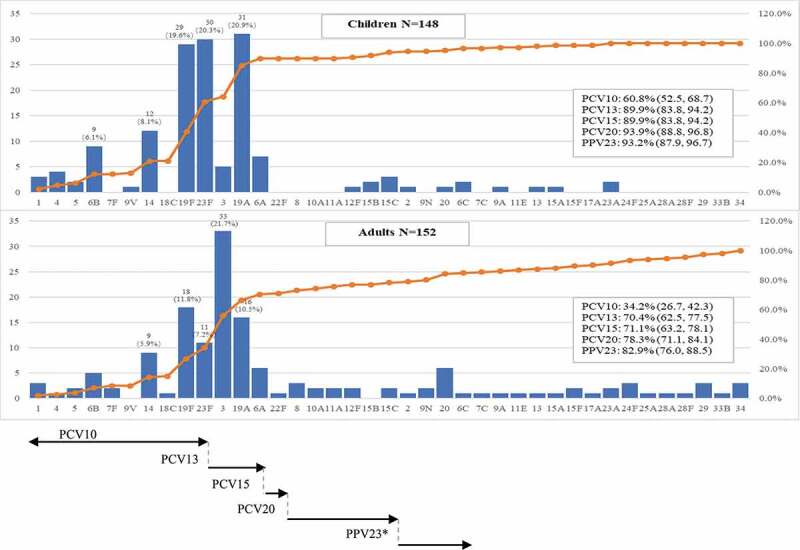
Figure 2.

Serotype distribution of S. pneumoniae isolates in children and adults
Data are presented as the number and the percentage (n/%) of serotyped isolates for 4 most prevalent serotypes in the study with the cumulative percentages of serotype distribution among children and adults. Vaccine coverages are presented by point estimate and corresponding 95%CI for PCV10, PCV13, PCV15, PCV20 and PPV 23. Y-axis: number of isolates; X-axis: serotype; secondary axis: cumulative percentage (%); *PPV 23 does not cover 15 C; PCV 15 and 20 are under clinical investigation.
