
Figure 1.
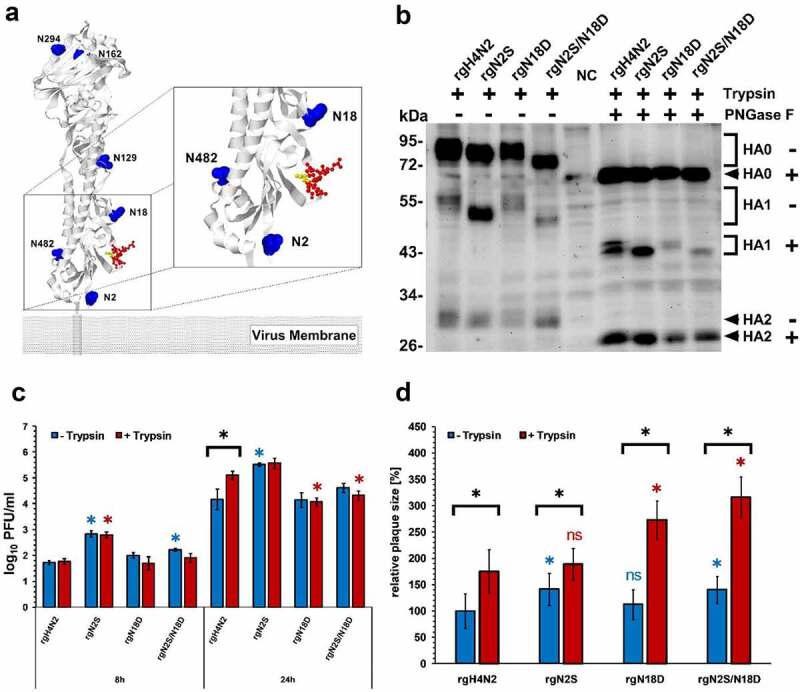
Structural modeling, expression, replication kinetics and cell-to-cell spread. Potential glycosylation sites are shown in blue, the CS is shown in red and threonine (TR/G) in the CS is in yellow. The model was generated by SWISS MODEL using the HA protein of H4N2 and further edited by Geneious. 2NYT4 was not found in the predicted PDB-3D structure, which starts from position 5 (a). Western Blot of HA after infection of MDCK cells with (+) or without (-) treatment with PNGase F in the presence of exogenous trypsin “T”. NC refers to negative control; naïve cells without infection (b). Replication kinetics in CEK cells at indicated time points after infection in the presence (T+) or absence (T-) of trypsin. Titration was done in MDCKII cells and the results are shown as mean ± standard deviation Log10 PFU/ml. Asterisks indicate significant differences at P < 0.05 of rgH4N2 compared to deglycosylated variants with or without exogenous trypsin (c). Cell-to-cell spread (d) was assessed by measuring 50 plaques in MDCKII with or without the addition of exogenous trypsin. Results expressed as mean and standard deviation relative to plaque size of rgH4N2 in the absence of trypsin. Asterisks indicate significant differences at P < 0.05 of rgH4N2 compared to deglycosylated variants with (red asterisk) or without trypsin (blue asterisk) and among each virus with or without the exogenous protease (black asterisk). ns = not significant compared to rgH4N2 with or without trypsin (D). Asterisks indicate significant differences at P < 0.05 of rgH4N2 compared to deglycosylated variants