
Figure 3.
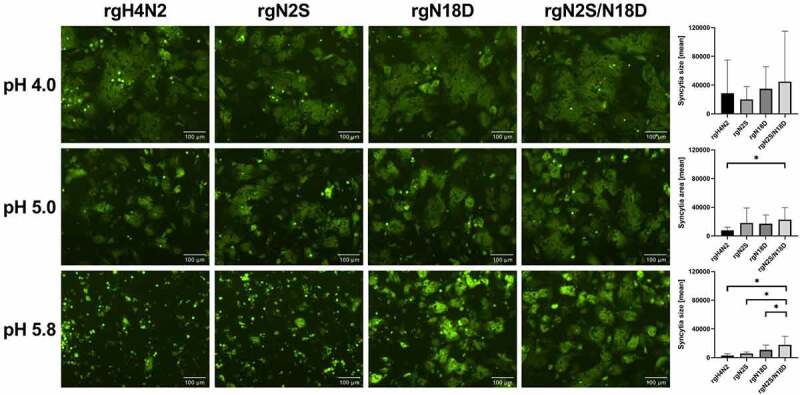
Impact of deglycosylation to trigger fusion at different pH values. Fluorescence microscopy of syncytia formation in QM-9 cells after expression of HA of rgH4N2 and HA carrying N2S, N18D or N2S/N18D as well as GFP, and activation at pH of 4.0, 5.0 and 5.8. Bars = 100 µm. Syncytia were measured and the average area and standard deviation for each virus is shown. Asterisks indicate significance difference at p < 0.05