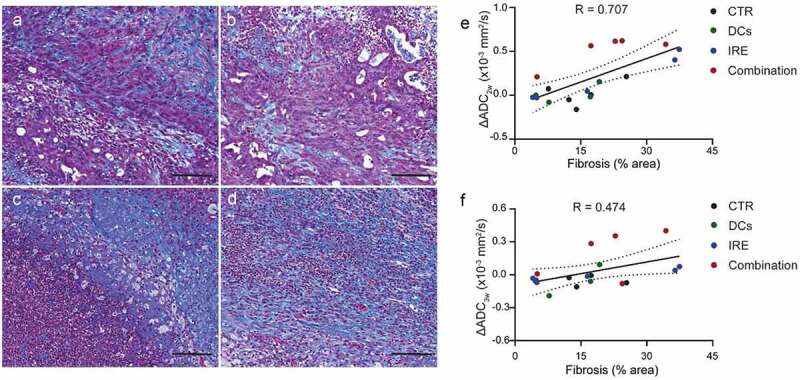
Figure 5.

Trichrome staining and quantitative measurement of the fraction of fibrotic area. Representative images of trichrome staining of, (a), control, (b), DC vaccine, (c), IRE treatment, and (d), combination IRE and DC vaccine treatment three weeks after tumor inoculation. Scale bars represent 100 μm. (e), Linear correlation analyses between ΔADC2w values and histology measurement of fibrosis area. R = 0.707, P < .001. (f), Linear correlation analyses between ΔADC3w values and histology measurement of fibrosis area. R = 0.474, P = .047
