Figure 5.

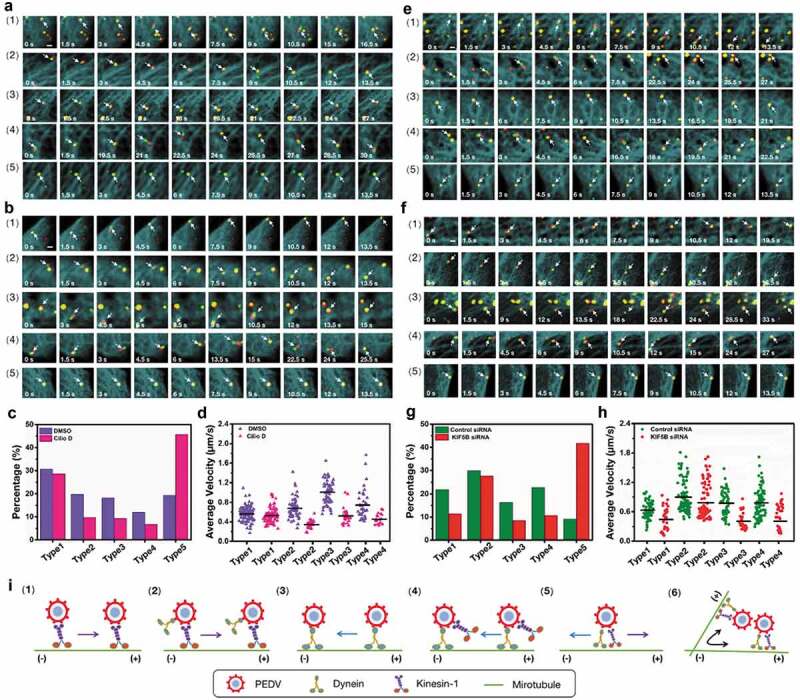
Cooperation between dynein and kinesin-1 during PEDV intercellular transport. (a)-(b) Representative time-lapse fluorescence images of PEDV particles during intercellular transport in live Vero cells transfected with EGFP-MT and mKO2- KIF5B corresponding to the (a) control DMSO treated and (b) dynein inhibited conditions. White arrows indicate PEDV particles. Scale bar, 1 μm. (c) Proportions corresponding to five types of PEDV intercellular transport according to (a) and (b). (d) Average velocities corresponding to motion states of PEDV intercellular transport according to (a) and (b). (e)-(f) Representative time-lapse fluorescence images of PEDV particles during intercellular transport in live Vero cells transfected with EGFP-MT and mKO2-dynein corresponding to (e) control siRNA and (f) KIF5B knockdown conditions. White arrows indicate PEDV particles. Scale bar, 1 μm. (g) Proportions corresponding to five types of PEDV intercellular transport according to (e) and (f). (h) Average velocities corresponding to motion states of PEDV intercellular transport according to (e) and (f). (i) Models corresponding to motion states of PEDV intercellular transport
