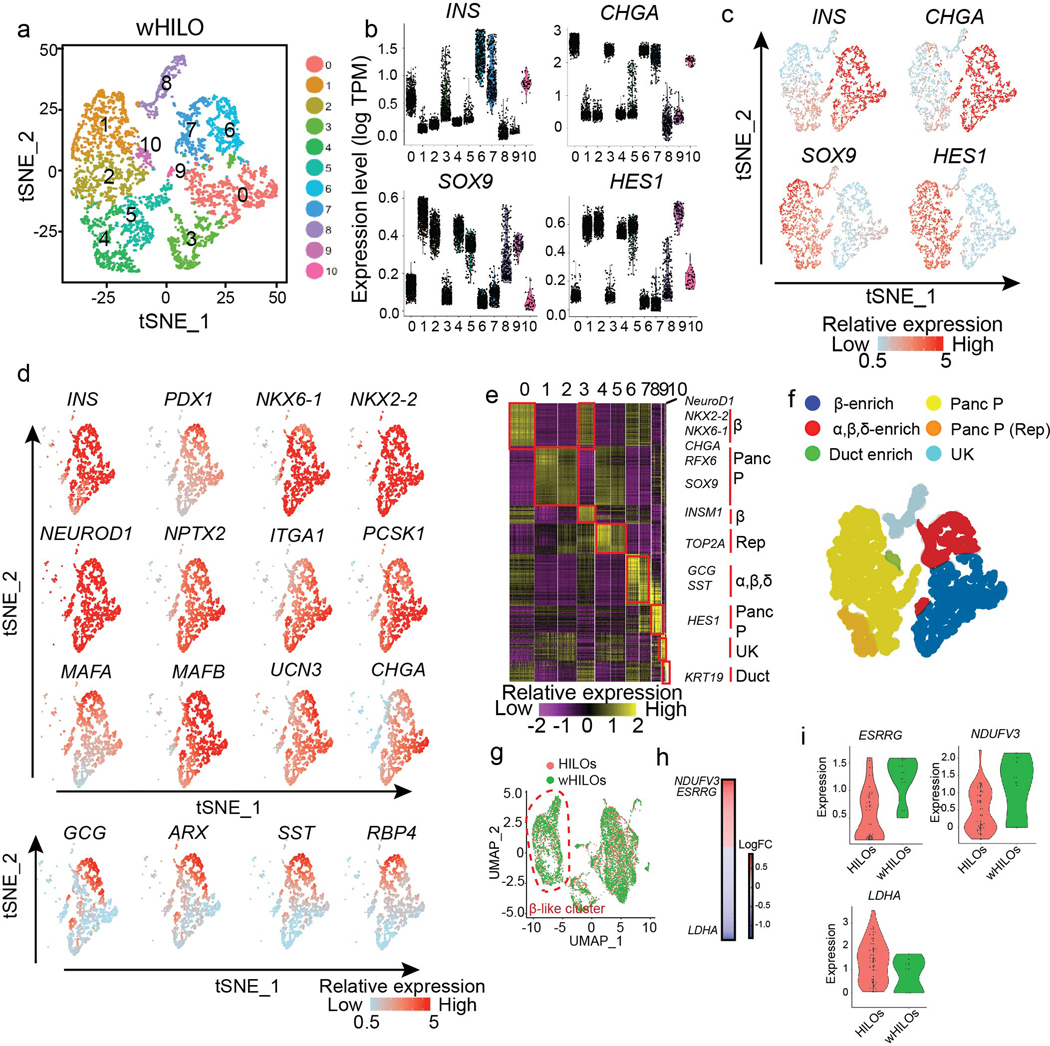
Extended Data Fig. 8. Single cell analysis of wHILOs.
a, tSNE clustering of single cell transcriptomes from WNT4-treated HILOs (wHILOs, n=4840). b, c, Violin Plots (b) and single cell expression (c) of INS, CHGA, SOX9, HES1 in wHILOs. d, Expression of β cell-enriched (INS, PDX1, NKX6–1, NKX2–2, NEUROD1, NPTX2, ITGA1, PCSK1, MAFA, MAFB, UCN3, CHGA), α cell-enriched (GCG, ARX) and δ cell-enriched genes (SST, RBP4) overlaid on tSNE clustering. e, Heatmap of top 10 differentially expressed genes in each cell cluster. f, tSNE clusters colored according to cell type (Panc P = pancreatic progenitor, Rep = replicating, UK = unknown) g, UMAP clustering of combined HILOs and wHILO single cell data sets after expression restoration of sparse counts using SAVER. h, Heatmap shows the differentially expressed genes (LogFC) between HILOs and wHILOs in ESRRG and INS double positive cells using WhichCells function (expression > 0.1). i, Distribution of ERRγ (ESRRG; min: 0.10, 0.50; 1stQ: 0.14, 1.15; mean: 0.54, 1.22; 3rdQ 0.90, 1.56; max: 1.60, 1.60 for HILOs and wHILOs respectively), NDUFV3 (min: −0.31, 1.21; 1stQ; −0.01, 1.33; mean: 0.49, 1.67; 3rdQ 1.00, 1.98; max: 2.22, 2.14 for HILOs and wHILOs respectively), LDHA (min: 0.05, 1.02; 1stQ; 0.50, 1.21; mean: 1.35, 1.33; 3rdQ 1.90, 1.44; max: 3.53, 1.67 for HILOs and wHILOs respectively) gene expression in ESRRG and INS double-positive HILOs (n=38) and wHILOs (n=9). Data pooled from three independent samples (a-i).

