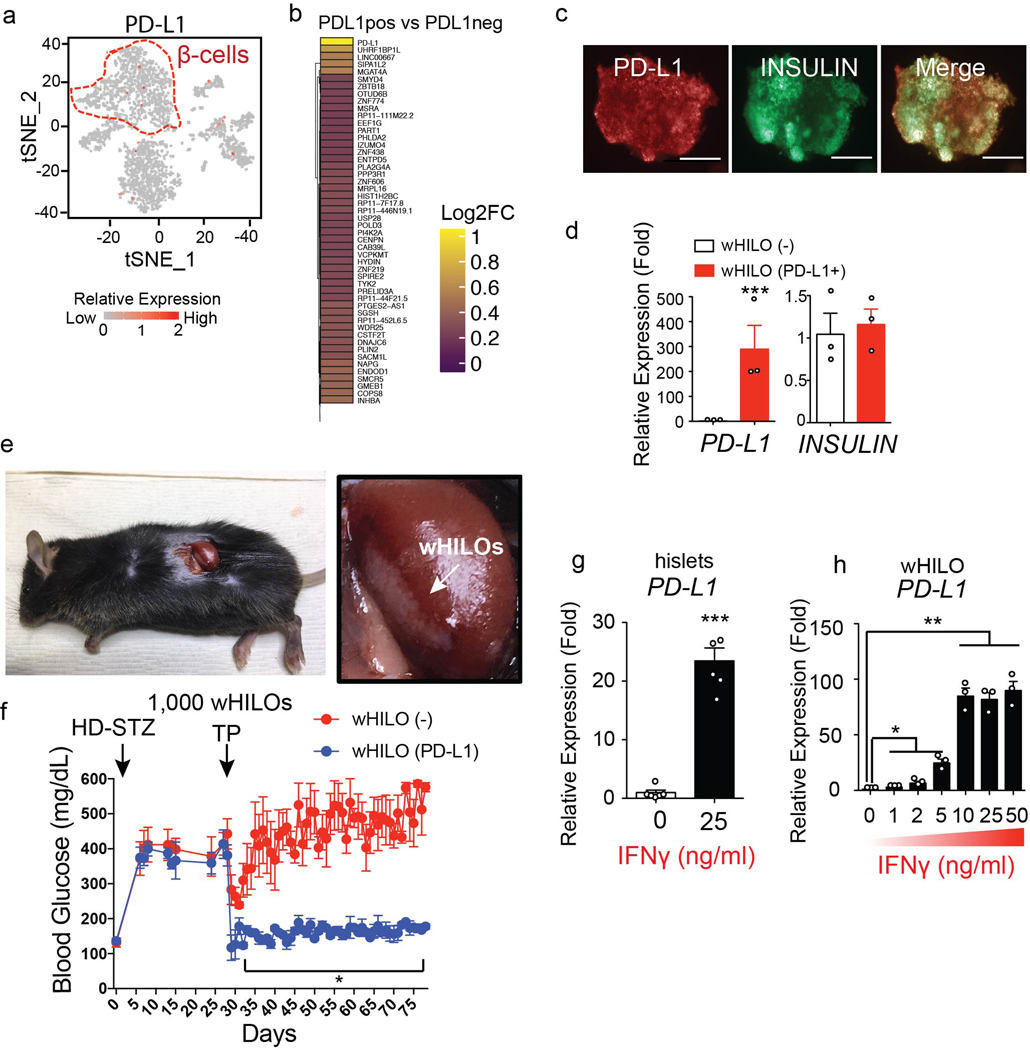
Extended Data Fig. 9. PD-L1 expression in HILOs.
a, Endogenous PD-L1 expression highlighted in red in human islet cells (n= 3245) (β cells are outlined in red). b, Heatmap of top differentially expressed genes between PD-L1+ and PD-L1- β cells. c, Immunohistochemistry showing overlap of lentiviral-driven PD-L1 expression and insulin promoter-driven GFP expression in wHILOs (scale bar, 100μm). d, Human PD-L1 and human insulin expression in wHILOs with and without lentiviral PD-L1 overexpression, as measured by qPCR (n=3). e, Transplantation of PD-L1 overexpressing wHILOs into the kidney capsule of STZ-induced diabetic mice. f, Blood glucose levels of C57BL6J mice treated with high dose streptozotocin (HD-STZ) prior to transplantation of wHILOs with and without PD-L1 overexpression (500 wHILOs into each kidney, total 1,000 wHILOs) (n=3) g, PD-L1 expression in human islet 12 hours after IFNγ stimulation (n=5). h, PD-L1 expression in wHILOs 12 hours after indicated IFNγ stimulation (n=3). Error bars represent ± SEM. *p<0.05, **p<0.01, ***p<0.001, one-tailed, student’s paired t test. Data were pooled from 3 independent samples (a) or representative of 3 independent experiments (c, d, g, h).

