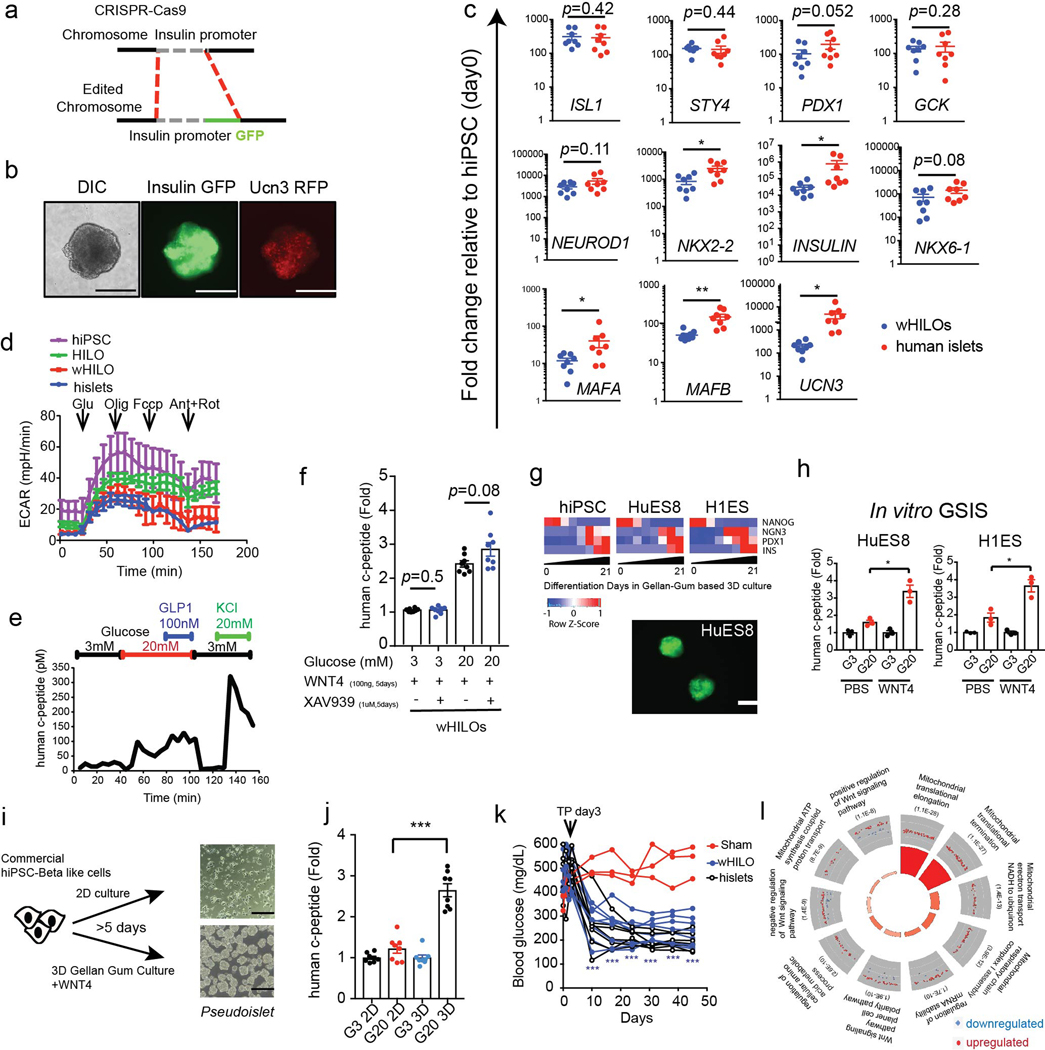
Extended Data Fig. 3. Phenotypic and genotypic characterization of HILOs.
a, Schematic of CRISPR-Cas9 knock-in for endogenous human insulin promoter-driven GFP expression in hiPSC. b, Representative differential interference contrast (DIC) images of wHILOs with insulin-GFP and UCN3-RFP expression (scale bar, 100μm, n=3). c, Relative expression of ISL1, SYT4, PDX1, GCK, NEUROD1, NKX2–2, INS, NKX6–1, MAFA, MAFB and UCN3 in wHILOs and human islets determined by qPCR (n=8 per sample type). d, Extracellular acidification rate (ECAR) measured in day 0 hiPSC spheroids (purple), PBS-treated HILOs (green), WNT4-treated HILOs (red) and human islets (blue) (n=3) e, Kinetics of human c-peptide secretion from WNT4-treated HILOs in response to progressive exposure to 3 mM glucose, 20 mM glucose, 20 mM glucose + 100 nM GLP-1, 3 mM glucose, and 3 mM glucose + 20 mM KCl. f, Glucose-stimulated human c-peptide secretion from wHILOs treated with and without XAV939 to promote β-catenin degradation (XAV939, 1μM for 3 days) (n=8) g, Temporal gene expression (NANOG, NGN3, PDX1, INS) during differentiation of hiPS, HUES8 and H1ES cells to HILOs (upper panel). Insulin-driven GFP expression in day 21 HILOs derived from HUES8 (lower panel, scale bar 100 μm). h, in vitro c-peptide secretion in response to 3 mM (G3) and 20 mM (G20) glucose in wHILOs from HUES8 and H1ES (n=3) i, Schematic depicting culture conditions for commercially available hiPSC-derived β-like cells (left) and light microscopy image of cultured cells (right, scale bar 100 μm). j, in vitro c-peptide secretion in response to 3 mM (G3) and 20 mM (G20) glucose from cultures described in (i) (n=8) k, Blood glucose levels in STZ-induced diabetic NOD-SCID mice. Transplantation (TP) of 500 wHILOs, hislets, or sham surgery was performed at day 3 (n=7, 6, and 3, respectively). l, Gene ontology of transcriptional changes induced by WNT4 treatment (100ng/ml WNT4 from day 26 to day 33) in wHILOs. Error bars represent ± SEM. *p<0.05, **p<0.01, ***p<0.001, one-tailed, student’s paired t test. Data representative of 3 independent experiments (b-h, i lower panel, k) or experimental triplicates (i upper panel, l).

