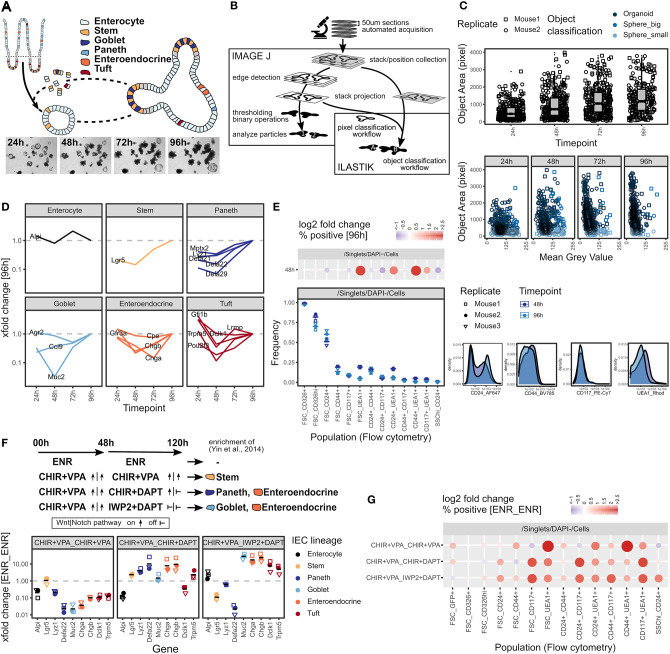
Figure 1.
Quantification of intestinal organoid growth and cellular composition. (A) Scheme of organoid formation and images of a representative position 24–96 h after seeding. Whole well is shown in Supplementary Figure 1a. (B) Scheme of organoid size quantification workflow using open-source tools ImageJ/Fiji and Ilastik. Visual quantification output and ImageJ quantification results are shown in Supplementary Figures 1b,c. (C) Box plots showing organoid size quantified as object area at 24–96 h timepoints (top). Object area vs. object mean gray value (8-bit scale) on a minimum projection of the image stack (bottom). Pooled data from 2 biol. replicates, indicated by shape. Each dot represents one organoid. (D) mRNA expression of IEC lineage marker genes at 24–96 h timepoints, measured by qRT-PCR. xfold change relative to 96 h organoids, median of 3 biol. replicates. (E) Flow cytometry of organoids grown for 48 and 96 h. Staining of representative replicate (bottom right). Population frequencies in Cells parent gate, 3 biol. replicates, indicated by shape. Mean highlighted (bottom left). Log2 fold change relative to 96 h timepoint, median of 3 biol. replicates. Dot size corresponds to absolute log2 fold change (top left). Gating strategy and population frequencies for FSC_CD326hi and FSC_CD24+ parent gates are shown in Supplementary Figures 1d,e. (F) Organoids cultured for 48 h followed by 72 h (48 h_72 h) with normal culture medium (ENR_ENR), or culture medium containing CHIR+VPA_CHIR+VPA, CHIR+VPA_CHIR+DAPT, or CHIR+VPA_IWP2+DAPT to modify IEC composition by interfering with Wnt and Notch signaling pathways as indicated, adapted from Yin et al. (2014). mRNA expression measured by qRT-PCR. xfold change relative to ENR_ENR treatment. 3 biol. replicates, indicated by shape. Mean highlighted. (G) Flow cytometry of organoids treated for 48_72h as indicated, population frequencies normalized to ENR_ENR treatment. Log2 fold change, median of 3 biol. replicates. Dot size corresponds to absolute log2 fold change. Gating strategy, representative staining and population frequencies for FSC_CD326hi and FSC_CD24+ parent gates are shown in Supplementary Figures 1d,f–h.

