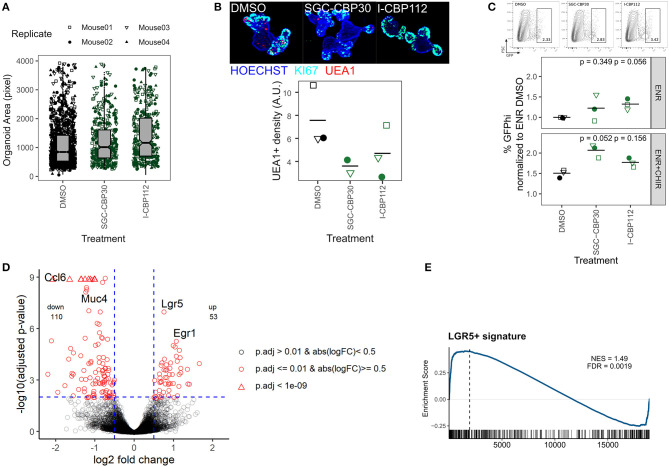
Figure 3.
Inhibition of EP300/CREBBP enhances organoid size and Lgr5 expression. (A) Organoids treated with DMSO, SCG-CBP30, or I-CBP112 for 96 h. Area of objects classified as “Organoid” by combined ImageJ/Ilastik workflow. 4 biol. replicates, indicated by shape. (B) Representative organoids treated with DMSO, SCG-CBP30, or I-CBP112 for 96 h. 10x magnification, max. intensity projection. KI67 staining marks crypt regions (top). Density of UEA1+ cells, each value represents the median of ≥5 organoids quantified. 3/2/3 biol. replicates, indicated by shape. Mean highlighted (bottom). Full wells for one representative replicate is shown in Supplementary Figure 3c. (C) Frequency of Lgr5-EGFP stem cells in reporter organoids grown in ENR or ENR+CHIR and treated with DMSO, SCG-CBP30, or I-CBP112 for 96 h, measured by flow cytometry. Gating of representative replicate grown in ENR (top) and percentage of GFPhi cells normalized to ENR DMSO condition of 3 biol. replicates, indicated by shape. Mean highlighted. Paired t-test (bottom). Percentage of total GFP+ cells is shown in Supplementary Figure 3d. (D) Volcano plot of mRNA sequencing of untreated vs. I-CBP112 treated organoids, 4 biol replicates per group. Selected genes are highlighted. (E) mRNA sequencing of untreated vs. I-CBP112 treated organoids. GSEA of LGR5+ stem cell signature from Muñoz et al. (2012) (GSE33949). Normalized enrichment score (NES) and false discovery rate (FDR) are indicated.

