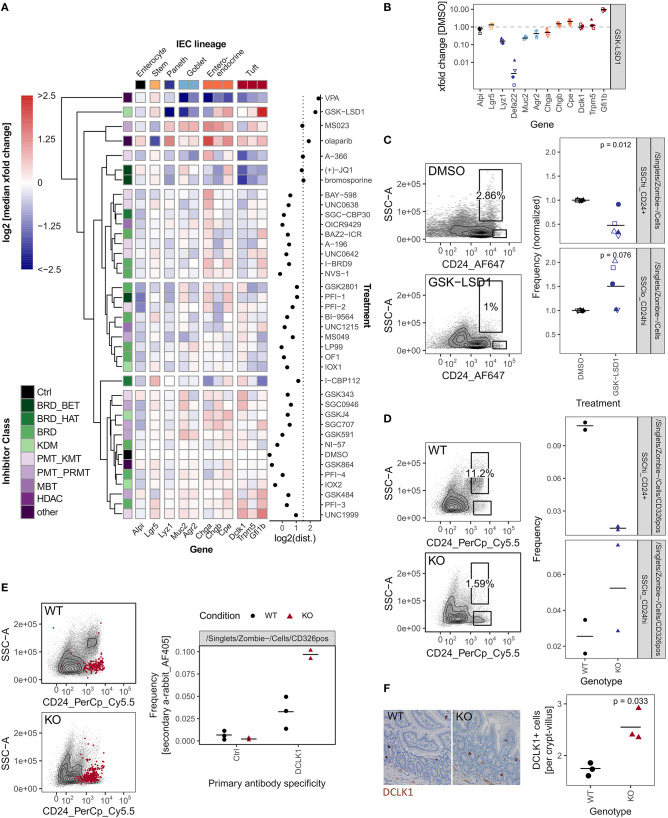
Figure 4.
GSK-LSD1 broadly affects IEC composition. (A) Gene expression of organoids treated with DMSO or inhibitors for 96 h, measured by qRT-PCR. Color scale represents log2 of median of xfold change relative to DMSO-treated organoids of 4 biol. replicates. IEC lineage marker genes are indicated on x-axis. Inhibitor class is indicated on y-axis. Clustering tree is based on Euclidean distance. Log2 of the Euclidean distance (“perturbation”) is indicated in the right panel, the line at x = 1.5 indicates inhibitors that were followed up in further experiments. Samples treated with HDAC inhibitors and gene Defa22 were excluded from the analysis. Euclidean distance including Defa22 is shown in Supplementary Figure 4a. (B) Gene expression of organoids treated with GSK-LSD1 for 96 h measured by qRT-PCR. xfold change relative to DMSO-treated organoids. 4 biol. replicates, indicated by shape. Median highlighted. (C) Flow cytometry of organoids treated with DMSO or GSK-LSD1 for 96 h. Gating of representative replicates (left) and normalized frequencies of SSChi_CD24+ and SSClo_CD24hi populations of 5 biol. replicates, indicated by shape. Mean highlighted. Paired t-test (right). (D) Flow cytometry of small intestinal crypts isolated from Villin-Cre+ Lsd1fl/fl (KO) mice with intestine-specific deletion of Lsd1 or wild type (WT) littermates. Gating of representative replicates (left) and frequencies of SSChi_CD24+ and SSClo_CD24hi populations of 2/2 mice (right). (E) Frequency of DCLK1+ cells measured by intracellular flow cytometry in small intestinal crypts from WT and KO mice. Overlay of positive cells for secondary anti-rabbit staining, representative replicate (left). Quantification of intracellular staining with rabbit anti-DCLK1 primary antibody or control in small intestinal crypts isolated from WT or KO mice. 3/2 mice. Minimum 7,000 viable cells in parent gate (right). (F) DCLK1+ cells per crypt-villus pair in duodenum of WT and KO mice. Immunohistochemistry staining of tissue sections. Representative staining (left) and quantification in 3/3 mice, mean highlighted. Unpaired t-test (right).

