Figure 5.
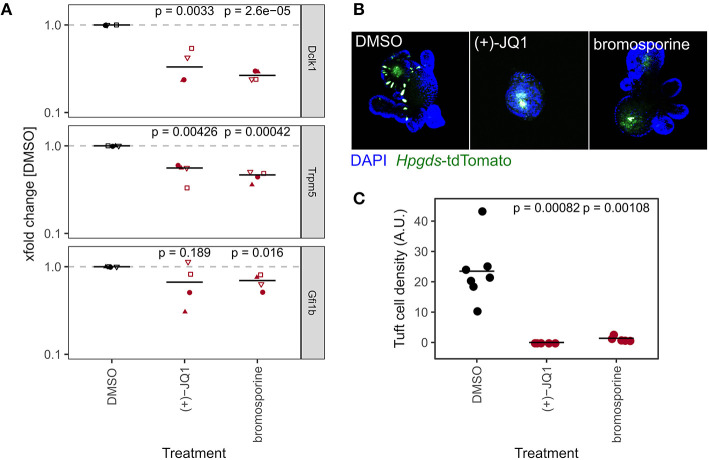
BET inhibition reduces relative abundance of tuft cells. (A) Gene expression of tuft cell marker genes of organoids treated with DMSO, (+)-JQ1, or bromosporine for 96 h, measured by qRT-PCR. xfold change relative to DMSO-treated organoids. 4 biol. replicates, indicated by shape. Median highlighted. Paired t-test. (B) Representative Hpgds-tdTomato tuft cell reporter organoids treated with DMSO, (+)-JQ1, or bromosporine for 8 days with one passage. 10x magnification, max. intensity projection. (C) Tuft cell density in Hpgds-tdTomato organoids with DMSO, (+)-JQ1, or bromosporine for 8 days. Each dot represents one organoid. Unpaired t-test.

