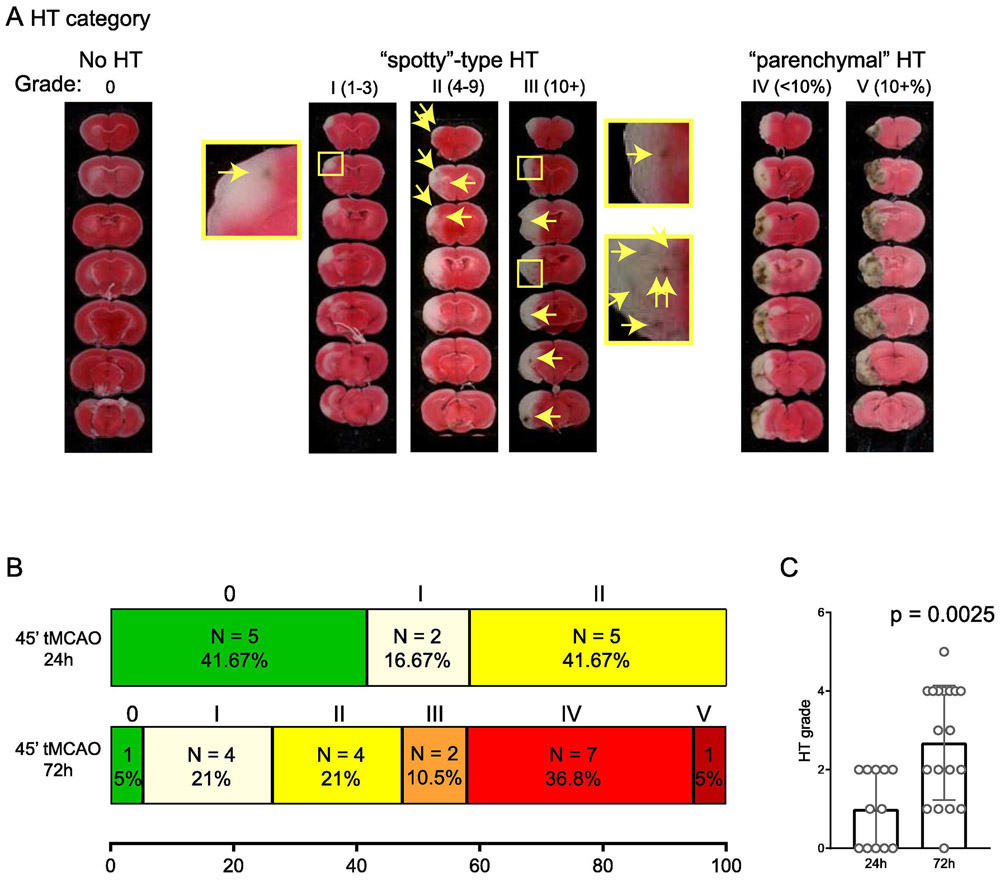
FIGURE 1. Development of HT at 24 and 72 hr time points.
(A) Representative images showing the categories of HT for scoring. The categories were based on a previous report but with modifications to better fit the fact that we are scoring multiple slices from one given mouse. Arrows in middle images and enlarged insets illustrate HT spots. For categories I-III, numbers in parenthesis indicate the range of number of HT spots included in that category. For categories IV and V, numbers in parenthesis indicate the % area of HT as compared to contralateral brain. (B) Summary of HT categories at 24 and 72 hr following 45 min tMCAO. (C) Bar graph showing average HT grade at 24 and 72 hr. For quantification, categories 0-V is converted to scores of 0-5. Each dot represents one animal. P value was from 2-tailed Mann-Whitney U test.

