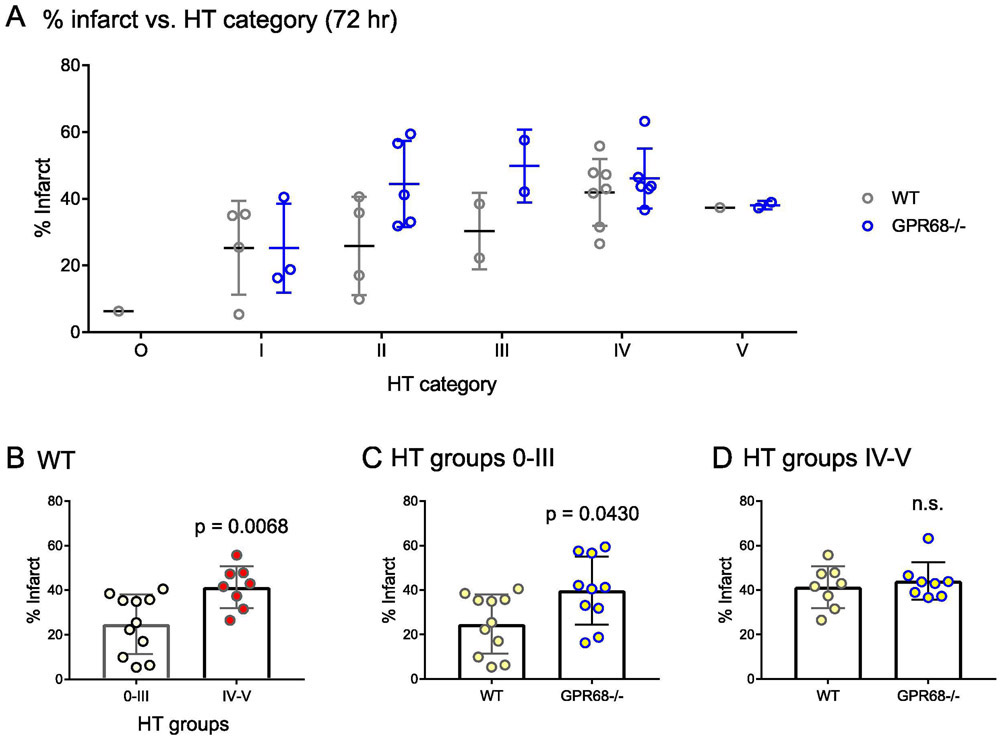
FIGURE 3. Correlation between infarct size and HT severity.
(A) Scatter plot to summarize the infarct % over HT grades. (B) Quantification showing the average % infarct for WT, separated based on HT grades 0-III and IV-V. (C & D) Quantification showing the effect of GPR68 deletion on infarct percentage based on HT grades 0-III (C) or IV-V (D). P values were from 2-tailed Mann-Whitney U test.

