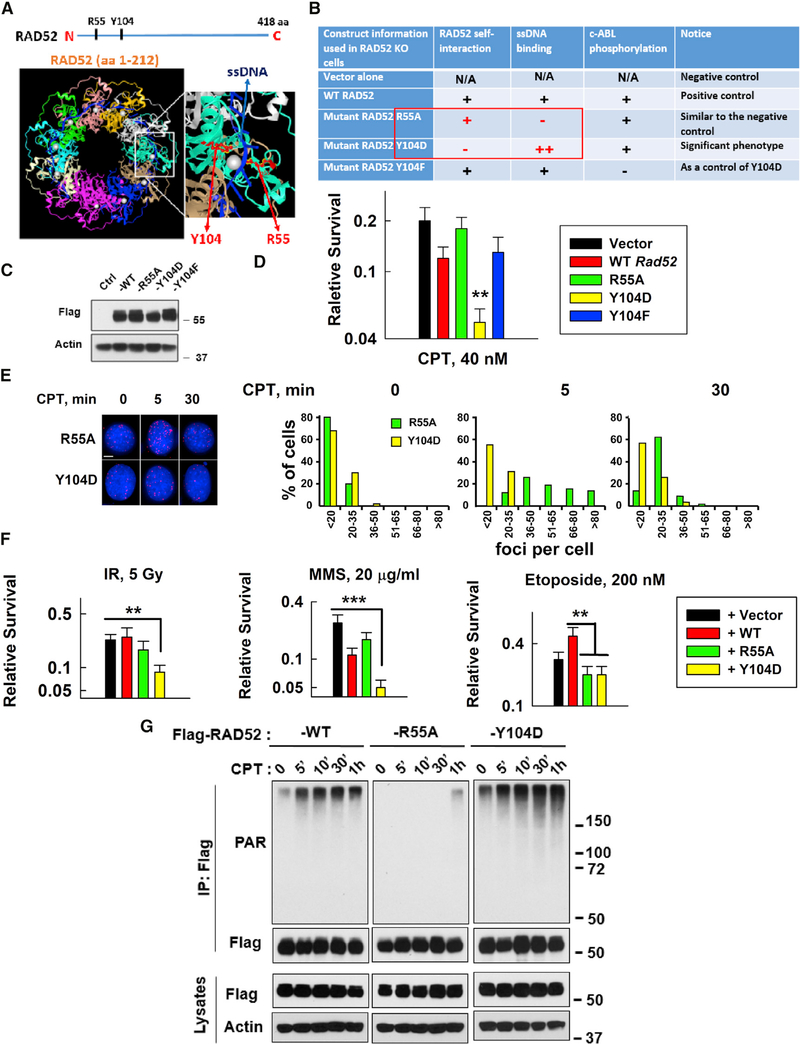
Figure 4. A Strategy to Enhance the Inhibitory Effects of RAD52 on SSBR and Sensitize Cells to DNA-Damaging Agents.
(A and B) Description of key RAD52 mutants (R55A and Y104D) tested in this study. Y104 is conserved across variant species. Y104F (abolished Abelson tyrosine kinase (c-ABL) phosphorylation) was used as a control for Y104D.
(C) Expression of FLAG-tagged WT or mutant mouse Rad52 in Rad52-deficient MEFs was measured using western blotting.
(D) Sensitivity of vector, WT, or mutant Rad52-expressing cells to CPT (40 nM). Data are mean ± SEM from three independent experiments. **p < 0.01.
(E) Left: images of XRCC1/LIG3α foci in R55A or Y104 mutant Rasd52-expressing Rad52-deficient MEFs on slides treated with or without CPT (20 nM) for 5 min and then fixed for PLA (scale bar represents 5 μM). Right: the plots show the percentage of XRCC1/LIG3α foci in R55A or Y104 mutant Rad52-expressing Rad52-deficient MEFs with different numbers of foci/cell after CPT treatment from 5 to 6 randomly selected fields (n = 50 cells) in each group, quantified using ImageJ.
(F) Sensitivity of MEFs expressing vector, WT, or mutant Rad52 (R55A or Y104D) to different DNA damage inducers: IR; MMS; or etoposide (Top II inhibitor). Data are mean ± SEM from three independent experiments. For IR- and MMS-treated cells, as compared to empty-vector-expressing cells, **p < 0.01 and ***p < 0.001; for etoposide-treated cells, as compared to WT Rad52-expressing cells, **p < 0.01.
(G) Comparison of CPT-induced PARylation levels between WT and mutant Rad52-expressing (R55A or Y104D) HEK293T cells under the same conditions as described in Figure S7A.

