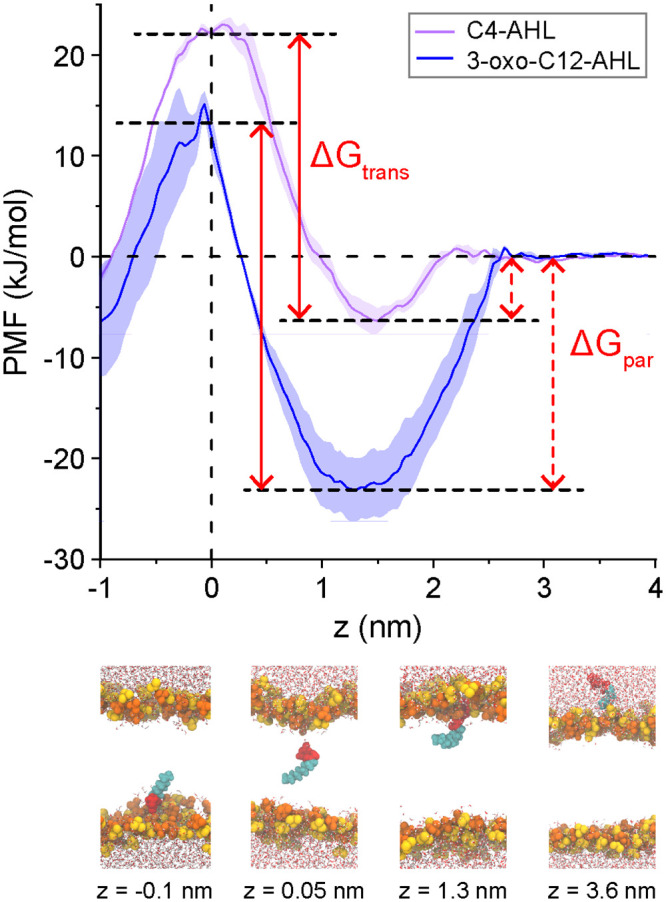
Fig 3. Potentials of mean force (PMFs) of C4-AHL and 3-oxo-C12-AHL as a function of the distance along the DOPC bilayer normal (z).

PMFs were computed using umbrella sampling with the PMF set to zero at z = 4 nm. Each curve shows the average of two independent PMFs and error bars shows the standard deviation. The midplane of the membrane is at z = 0 nm. The plots also illustrate the definition of ΔGpar as the free energy difference between the PMF minimum and the value in solution and ΔGtrans as the free energy difference between the PMF minimum and maximum. Snapshots at bottom illustrate the configurations of AHLs and bilayers for different characteristic values of z in the PMF of 3-oxo-C12-AHL. Lipid head groups are yellow/orange, AHL head groups are red, AHL tail groups are cyan, and water is drawn as red/white. Lipid tail groups are not shown for clarity.
