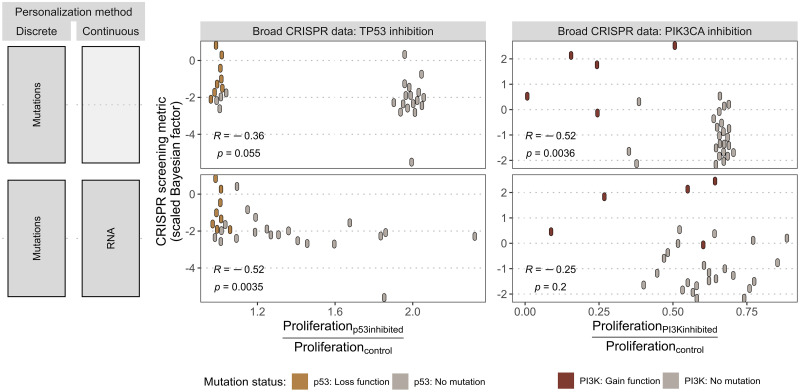
Fig 6. Application of personalized models to other CRISPR targets.
(A) Personalization strategies using either mutations only (as discrete data) or combined with RNA (as continuous data) with their corresponding scatter plots in panels B and C. (B) Scatter plot comparing normalized Proliferation scores of p53 inhibition in the models with experiment sensitivity of cell lines to TP53 CRISPR inhibition, indicating p53 mutational status as interpreted in the model. Pearson correlations and the corresponding p-values are shown. (C) Similar analysis as in panel B with PI3K model node and PIK3CA CRISPR inhibition.

