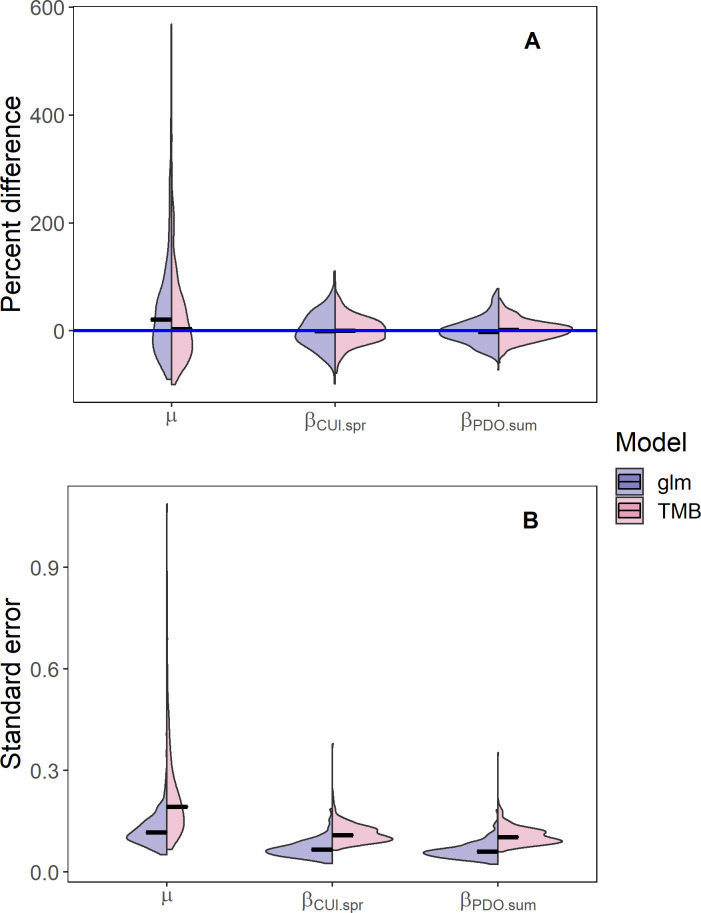
Fig 6. Differences between the mean survival and standard error of the mean survival for models with fixed and random effects.
Split violin plot comparing the percent difference (upper panel) between the estimated and true parameter values and the standard errors for the fixed effects μ, βCUI.spr, and βPDO.sum (lower panel) for the mixed-effect model with AR1 processes for day and day/year interaction (TMB; blue violins) and the fixed-effect model for day, day2, and day/year interaction (glm; red violins) fit to simulated data for wild spring/summer Chinook salmon. Simulated the data were generated from the model with the lowest AIC for wild fish (see Table 4). Horizontal lines represent median values for the violins and the horizontal blue line in panel (A) represents zero percent difference between the estimated and true parameter values.

