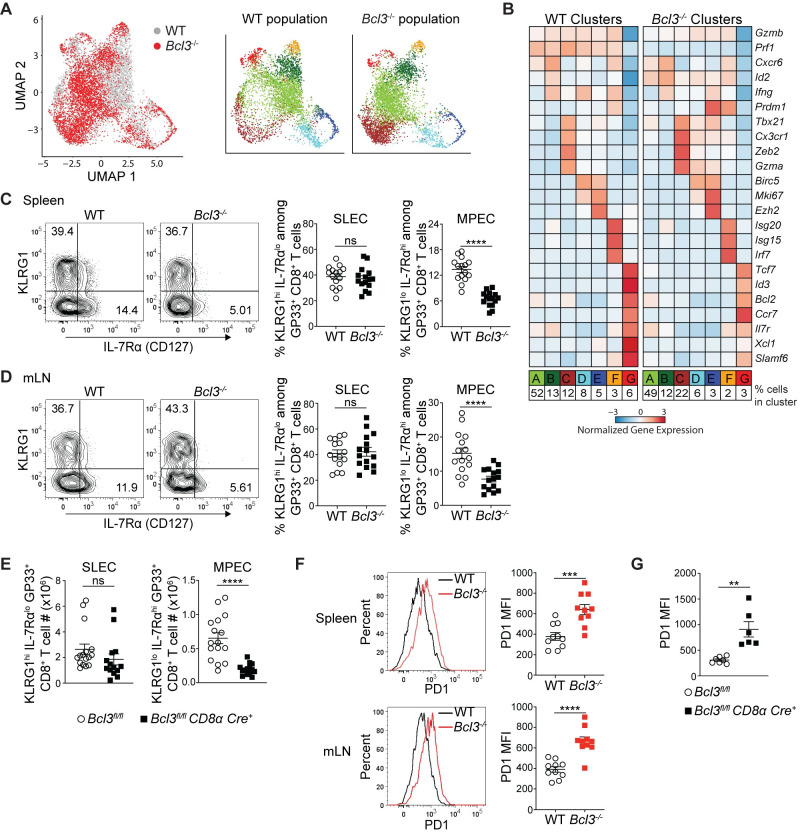
Fig 2. Bcl-3 supports formation of memory precursor effector CD8+ T cells.
(A and B) Bcl-3 KO and WT H-2Db-GP33+ cells isolated on d 8 p.i. from mixed bone marrow chimeras were analyzed by scRNA-seq. (A) Left UMAP plot shows Bcl-3 KO and WT cells colored by genotype as indicated. Bcl-3 KO and WT populations were subsequently clustered independently and detected clusters were projected on the previous UMAP plot (right panels) and color-coded. (B) Heatmap shows row-standardized expression of selected genes among clusters of Bcl-3 KO and WT cells displayed in (A). For each genotype, percentages listed at bottom indicate the size of individual clusters relative to the total population. (C and D) 8 d p.i. mixed bone marrow chimeras were analyzed for SLECs (short lived effector cells, KLRG1hi IL-7Rαlo) and MPECs (memory precursor effector cells, KLRG1lo IL-7Rαhi) subsets. Representative contour plots show the proportions of SLEC and MPEC cells in WT or Bcl3-/- H-Db-GP33+ CD8+ T cells in spleen (C; left panels) and mLN (D; left panels). Right graphs summarize data from three independent experiments with n = 15 mice for each CD8+ T cell genotype. (E) Absolute numbers of SLEC and MPEC subsets in spleen of Bcl3fl/fl CD8α Cre or control mice 8 days after LCMV Armstrong infection. Data are averages of three independent experiments with n = 14–16 mice for each genotype. (F) Representative histograms show the intensity of PD1 expression on WT or Bcl3-/- H-Db-GP33+ CD8+ T cells from spleen and mLN of mixed bone marrow chimera 8 d p.i. with LCMV Armstrong (left panel). Right graphs summarize data from two independent experiments with n = 10 mice for each CD8+ T cell genotype. (G) Summary of PD1 expression on LCMV antigen GP33 specific CD8+ T cells in spleen. Data are representative of two independent experiments with n = 5 mice in each group. Error bars indicate SEM. **p<0.01, ***p<0.001, ****p<0.0001. ns = not significant.

