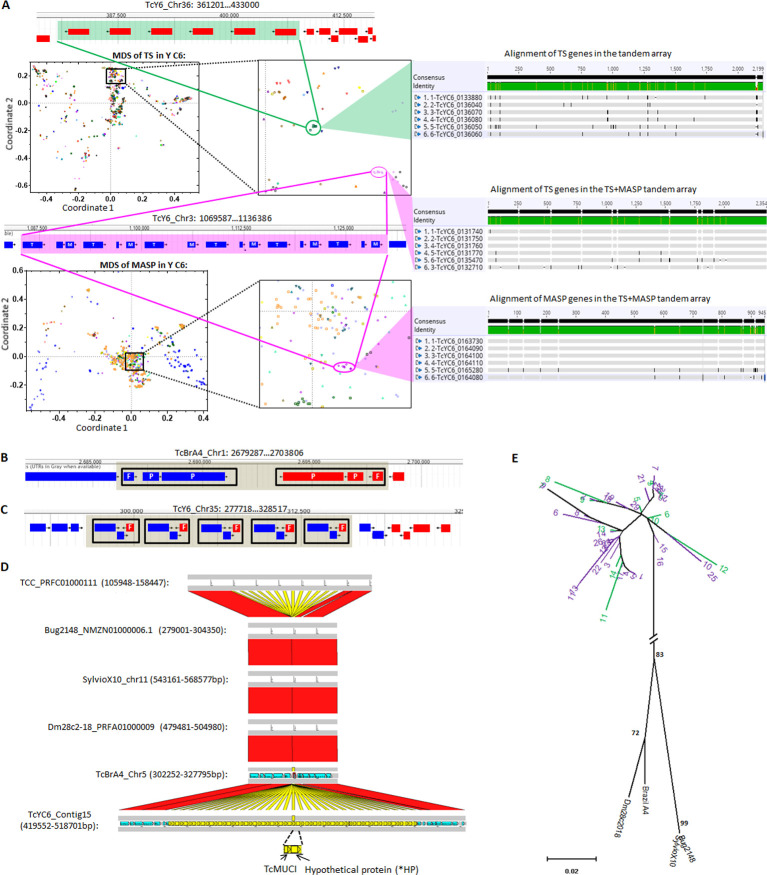
Fig 4. Gene amplification events in members of large gene families.
(A) Tandem arrays of individual TS genes (top), and a TS+MASP pair (bottom) clustered based upon genetic distance in the MDS plots. Each chromosome is displayed as a separate pattern on the MDS plot. T: TS; M: MASP. Alignment of the genes in each MDS cluster (right) confirms high consensus (grey regions); black regions indicate SNPs and ‘–’ indicate gaps. (B) Mirror-duplication of one fragmented RHS and two RHS pseudogenes. P: pseudogene; F: fragment. (C) One RHS (+), one hypothetical protein (+) and one fragmented glycosyltransferase (-) replicated 5 times, creating multiple strand switches. F: fragment. (D) Syntenic regions of the TcMUCI+*HP tandem array detected in 6 long-read sequenced T. cruzi strains. Synteny of TcMUCI orthologs are labeled in yellow. (E) Bayesian inference of phylogeny of all TcMUCI orthologs from the 6 strains. Note that TcMUCI genes from Y C6 (purple) and TCC (green) are intermingled in the top portion of the tree, indicating the retention of high similarity in these lineages, and are collectively distant from their next nearest mucins in 4 T. cruzi genomes lacking this array. Live MDS plots can be explored at http://shiny.ctegd.uga.edu. Alignments were performed using Geneious software (v11.0.4).

