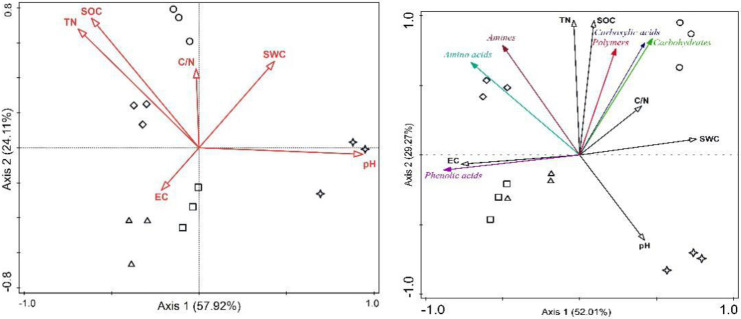
Fig 5.
RDA based on AWCD and soil properties (left) and six carbon source utilization and soil properties(right) among different extract concentration treatments. Symbols indicate concentrations (circle: 0 g‧mL-1, triangle: 2.5 mg‧mL-1, diamond: 5 mg‧mL-1, square: 7.5 mg‧mL-1, star: 10 mg‧mL-1). SWC: soil water content, EC: electrical conductivity, TN: total nitrogen, SOC: soil organic carbon and C/N: C: N ratio.

