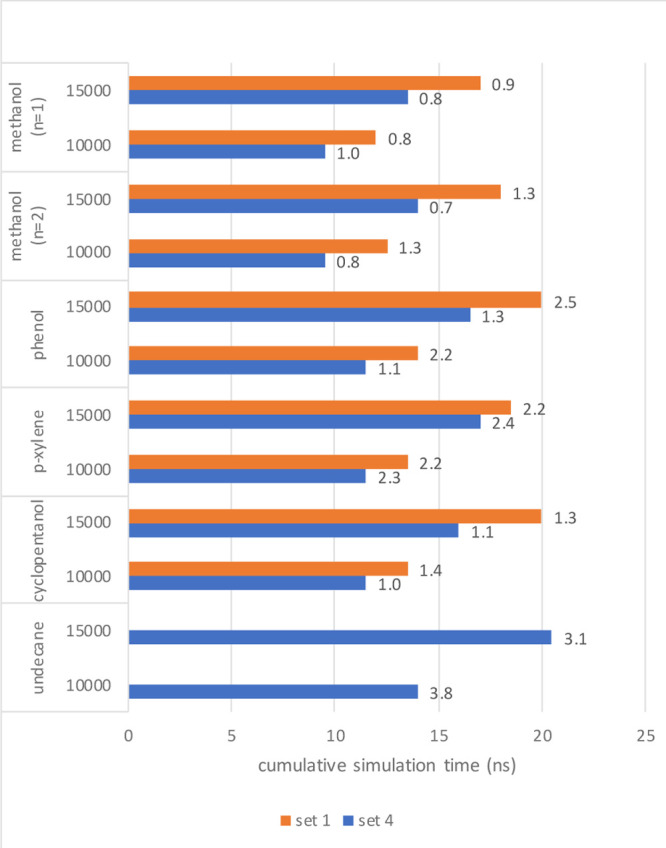
Figure 6.

Result from convergence analysis; total simulation time required to reach convergence based on the minimum number of contributing frames of 10,000 or 15,000 for simulations for set 1 (orange) and set 4 (blue). When no bar is shown, convergence was not yet reached (with a maximum simulation time of 5 ns per λ-point). The value on the right side of the bars gives the MAE (in kJ/mol) of the converged simulation with respect to the reference data (21 λ-points for 5 ns).
