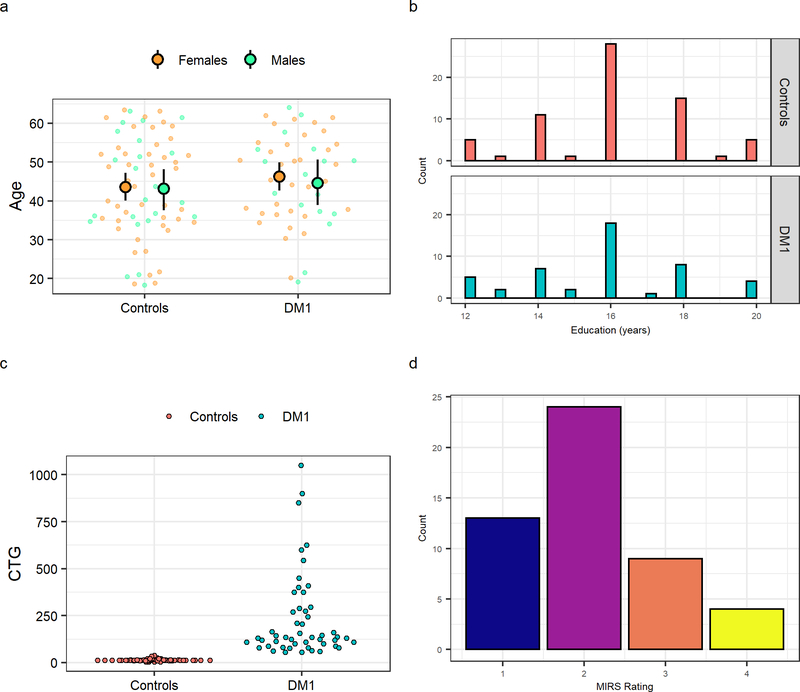
Figure 1:
Sample characteristics. Panel a shows the age distributions of unaffected individuals and DM1- affected adults, separated by sex. Large circles represent the means with 95% confidence limits and the small circles represent individual observations Sex distribution was not different between groups (X2 (1, N = 118) = 6.63 e−31, p = 1). Panel b illustrates the distribution of years of education distribution for unaffected individuals (top panel) and DM1-affected adults (lower panel). Education distribution (binned as less than 4-year college degree [< 16 years] and completed 4-year college degree or higher [≥ 16 years]) was not different between groups (X2 (1, N = 114) = 0.38, p = 0.54). Panel c depicts CTG trinucleotide repeat expansion for each unaffected adult and DM1-affected individual in the sample. Panel d shows Muscle Impairment Rating Scale (MIRS) distribution of DM1-affected adults. Scores of MIRS ≤ 2 indicate none to mild impairment and scores of MIRS ≥ 3 indicate moderate to severe muscle impairment.

