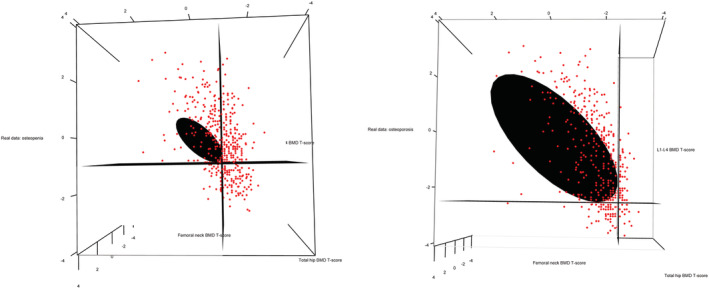
Fig 3.

Confidence ellipsoids for the diagnosis of osteoporosis and osteopenia in real data. Confidence ellipsoids were generated assuming the correlations between BMD measurements (ρ12, ρ13, ρ23) were 0.6558, 0.6145, and 0.7508. The first subfigure (A) is for the diagnosis of osteopenia. The second subfigure (B) is for the diagnosis of osteoperosis. Data points (red) are superimposed to show the clustering of these data points.
