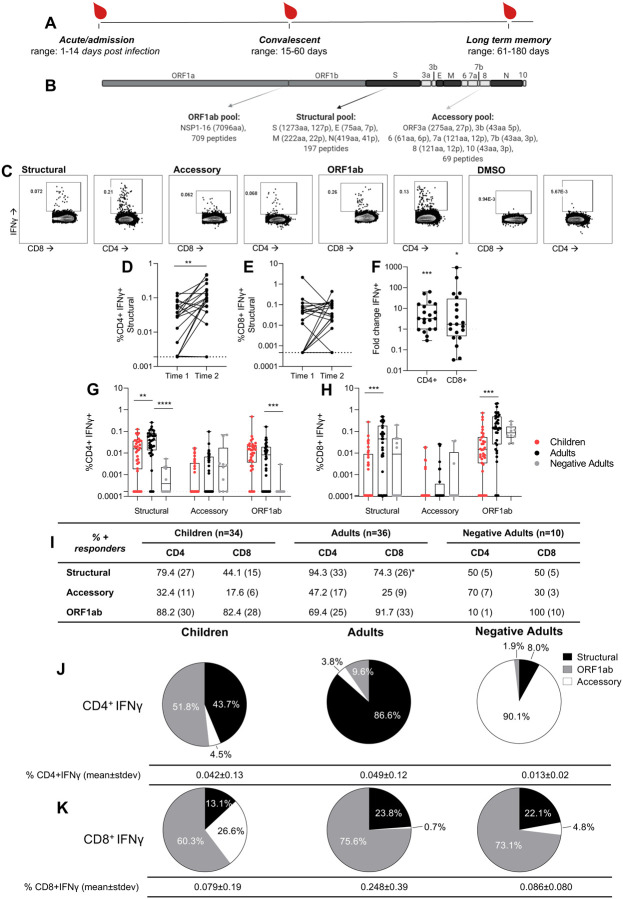
Figure 1 – Children have lower CD4+ and CD8 + T cell responses than adults with COVID-19. CD8+ T cell responses are predominantly ORF1ab specific, while children and adults have different CD4+ T cells targets.
(A) Heparinised blood samples for PBMCs were collected from COVID-19 patients in Hong Kong during the course of infection and recovery. (B) Overlapping peptide pools of the whole SARS-CoV-2 proteome were generated to represent ORF1ab, Structural, and Accessory proteins with amino acids (aa) and peptides (p) per protein shown. (C) PBMCs were stimulated with peptide pools or a DMSO control and IFNγ production of CD4+ and CD8+ T cells measured by flow cytometry. Paired time points at hospital admission and discharge (time 1: mean 7.25 +/−stdev 4.6 days post infection, range 3 to 18; time 2: mean 13.4 +/−stdev 4.4, range 6 to 21) for paired background (DMSO) subtracted structural specific IFNγ response of CD4+ (D) and CD8+ (E) T cells (n=20 adults). Wilcoxon test was used to determine differences **p<0.01. Dotted lines represent limit of detection following background subtraction (CD4=0.0019, CD8=0.00047). (F) The fold change of paired structural specific CD4+ and CD8+ T cells responses from (D, E), significance calculated using One sample Wilcoxon test against a theoretical median of 1. Dotted line at 1 indicates no fold change. The SARS-CoV-2 CD4+ (G) or CD8+ (H) T cell responses of COVID-19 children (n= 34), adults (n=36) (mean±stdev: 42±44, range 1–180 days) and negatives (n= 10). Data are displayed as individual responses to each peptide pool with IFNγ production to paired DMSO subtracted. The dotted line represents the lower limit of detection, determined as the smallest calculated value above the DMSO background response (IFNγ of CD4+=0.00017%, IFNγ of CD8+=0.00011%). Comparisons between groups were performed using Mann-Whitney test with the effect of the sampling time accounted for, statistical differences are indicated by *p<0.01, **p<0.001, ***p=0.0001. Values above the limit are used to classify participants as responders and presented as a percentage with the numbers of responders in brackets (I). Differences between children (n=34) and adults (n=36) from all time points (1 to 180 days post symptom onset) were determined by Fisher’s exact test and displayed in the adults column where *p<0.05. Pie charts show the proportion of total IFNγ+ CD4+ (J) and CD8+ (K) SARS-CoV-2 responses with DMSO subtracted in children (n=34), adults (n=36) and negatives (n=10) (from G, H). Values below the limit of detection assigned the value of 0.

