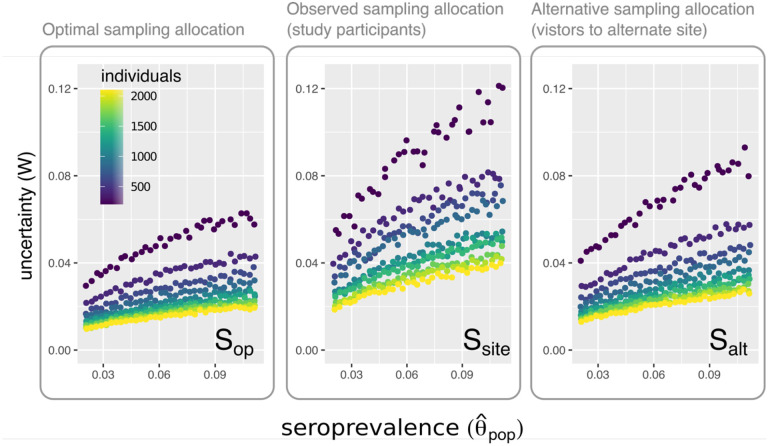
Figure 3. Uncertainty in estimated SARS-CoV-2 seroprevalence obtained using different sample allocation strategies.
The uncertainty (W, the width of the 95th percentile interval for 10000 estimated seroprevalence values) versus mean estimated seroprevalence for different values of n (the total number of individuals sampled) when individuals are sampled using (1) in the left panel, the optimal sample allocation according to Equation 2 in the Supplementary Material (Sop); (2), in the center panel, the sampling distribution of participants in the Somerville seroprevalence survey (Ssite); (3) the sampling distribution at the proposed alternative study site (Salt).

