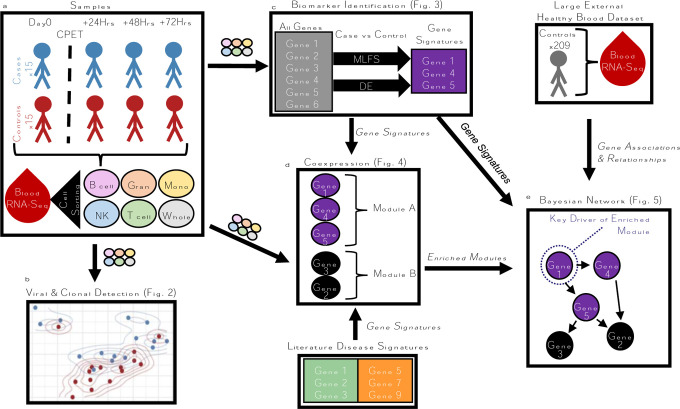
Fig. 1: Study Analysis Workflow.
A: RNA-seq read count data were generated on whole blood and FACs-sorted immune cell samples from CFS cases and controls. B: RNA-seq count data were passed through a viral-clonal detection pipeline. C: RNA-seq count data were passed through our MLFS and DE pipelines, generating predictive signatures of disease. D: Co-expression network construction organized genes into modules, which were annotated for biological pathways and other disease signatures. G: A union of modules with enrichment for CFS and CFS signatures were used with whole blood gene expression in an independent cohort to build a regulatory network where key drivers of disease were identified.

