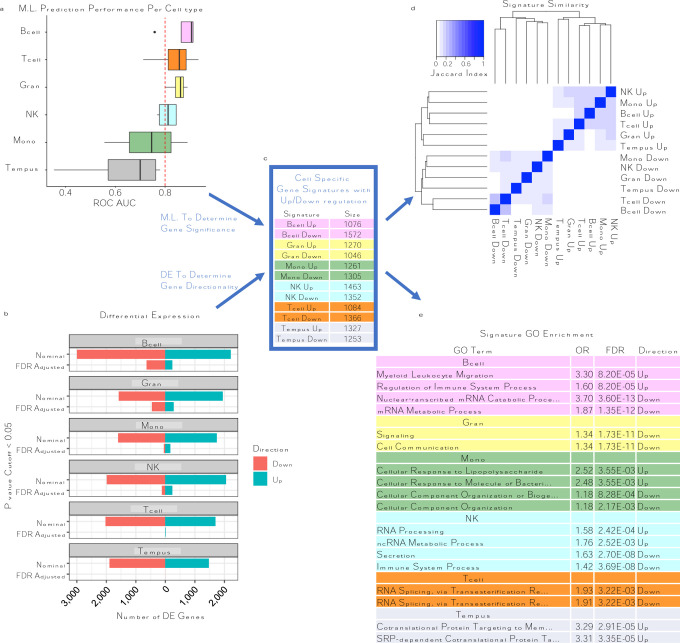
Fig. 3: Machine Learning Feature Selection (MLFS) identifies predictive signatures of CFS.
A: Classifier models built from CFS signatures show predictive ROC AUC performance on hold-out test sets across the different cell types (y-axis and color). B: DE analysis for CFS vs HC. X-axis represents the number of DE genes; bars are colored by direction of expression. Y-axis represents the different p value cutoff <0.05 of either Nominal or FDR adjusted p-value. C: CFS signatures were established using MLFS for significance and DE for expression directionality. Signatures are colored per cell type. D: Jaccard index showing signature similarity. E. Top GO enrichment table for signatures, colored per cell type.

