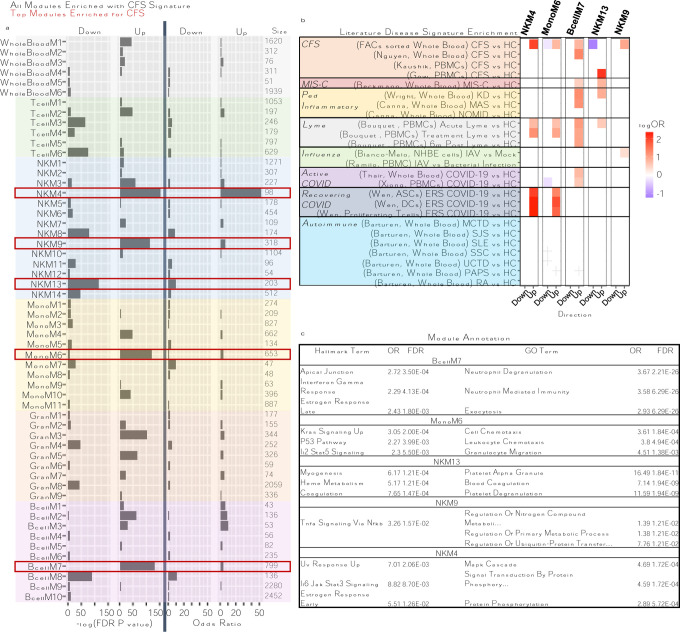
Fig. 4: Co-expression network analysis identifies modules of genes dysregulated in CFS and other disease signatures.
A: Table of all co-expression modules significantly associated with CFS signature, colored per cell type. X-axis represents either −log(FDR pvalue) or Odds Ratio (OR) of enrichment for CFS signature. The most significantly associated modules are highlighted with red boxes. B: Enrichment heatmap of top CFS modules and literature signatures from other disease. Y-axis represents disease signatures and are colored and grouped by the category of disease the signature falls into. C: Top 3 functional annotations of top CFS modules. This figure only shows those top modules with significant functional annotations.

