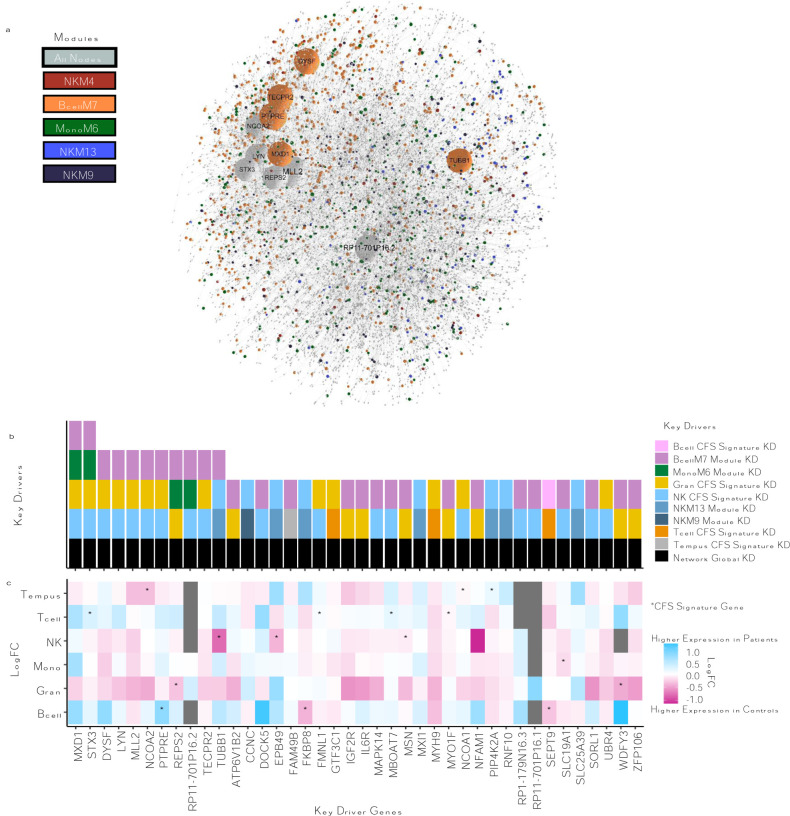
Fig. 5: Bayesian Network and Key Driver Analysis identifies regulators of CFS.
A: A 2D representation of the Bayesian network. B and C illustrate key drivers of the network. B: shows the frequency in which a gene is considered a KD. C: shows the DE logFC of the KD gene in the cell specific signatures.

