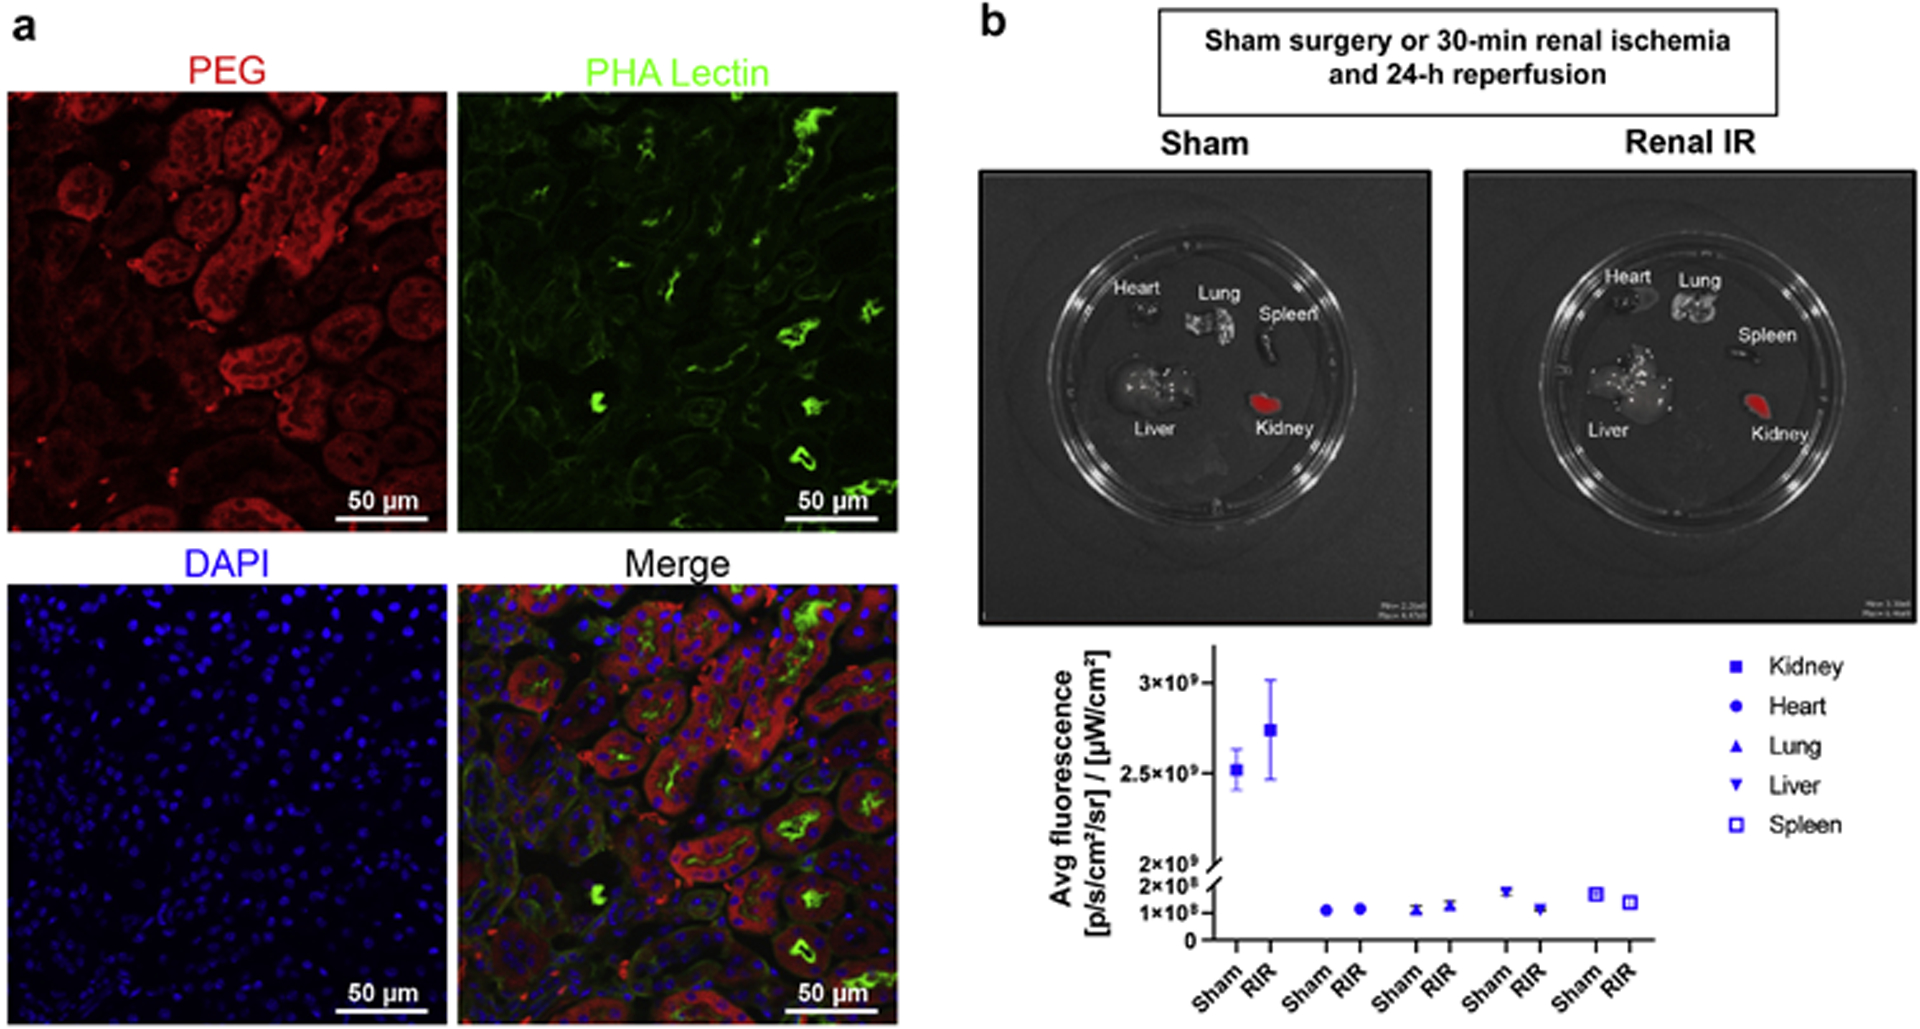
Figure 1. Confirmation of kidney selective and renal tubule cell MNP delivery.

A. Mouse kidney sections stained with anti-PEG antibody to detect MNP localization and PHA-lectin to mark renal proximal tubule cells and counterstained with DAPI to visualize cell nuclei. Mice were injected with ODN2088-encapsulated MNPs or with vehicle control 6 hr before renal IR injury. Renal proximal tubular distribution pattern for PEG was confirmed by co-localization of PEG antibody staining and PHA lectin staining in MNP-injected mice (200X images shown, representative of 3 experiments). Mice injected with vehicle control showed no PEG staining (data not shown). There was almost no PEG localization in other tubular segments, endothelial cells or mesangial cells in the glomeruli. B. (top) In vivo near-infrared fluorescence images of kidney, liver, lung, heart and spleen of mice injected with 75 mg/kg i.v. Cy5 mimic 3,3′-diethylthiadicarbocyanine iodide (DEDC)-loaded MNPs 6 hr before sham-surgery or 30 min renal ischemia and 24 hr reperfusion (Renal IR). (bottom) Quantification of average fluorescence efficiency per square centimeter in each organ demonstrating ~30-fold selective delivery of Cy5 MNPs to the kidneys compared to other organs in both sham-operated mice and mice subjected to renal IR injury (N=3). Data are background subtracted and represent mean ± SEM.
