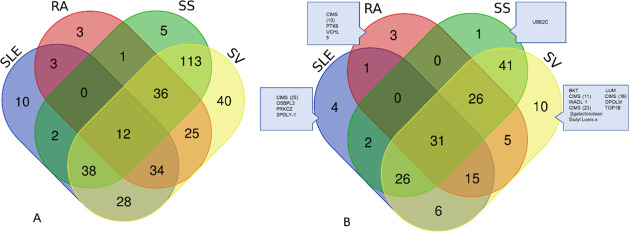
Figure 5.
Venn diagrams representing the overlap of variables generated from differential analysis (Wilcoxon signed rank test, q < 0.05) for SLE, RA, SS, and SV. Since an analyte may be targeted by more than one antibody diagram, (A) represents the overlap of antibodies, whereas (B) represents the overlap on an analyte level. Disease-specific analytes are outlined in (B). Diagram was created at http://bioinformatics.psb.ugent.be/webtools/Venn/.

