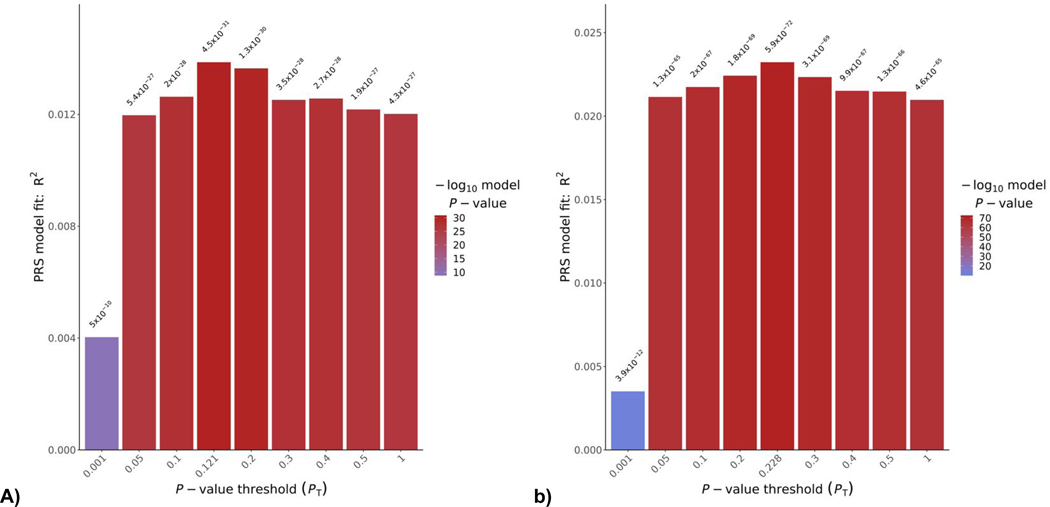
Figure 3. Cross Validation of Suicide Polygenic Case-Control Prediction.
Polygenic prediction of suicide death case status across two independent cohorts of cases and controls. Training GWAS summary statistics are used to score the test set for suicide polygenic risk. P-value thresholds are plotted on the x-axis from 0.1–1.0, reflecting the top 10% to 100% of the common variants from the training GWAS. Plots present model fit when a) predicting case-control status with wave 1 suicide vs. Generation Scotland summary statistics and b) predicting with wave 2 suicide vs. UK10K summary statistics. Scores are adjusted for 20 PCs. Summary data for the best fitting and 1.0 p-value threshold models are presented in Table S29.

