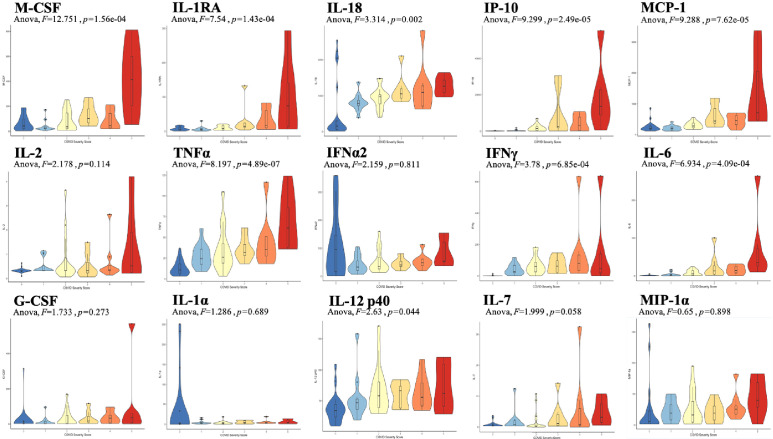
Figure 3. Violin plot representations of cytokine expression levels ordered by COVID Severity Score (CSS).
Cytokines ordered by row from upper left corner based on mutual information relevancy matrix (upper left being most relevant and lower right being least relevant). The x-axis is CSS, and the y-axis is analyte concentration in pg/mL. One-way ANOVA F values and p values are listed on each plot. Source code 1. R code with sections to apply the varrank package to the source data, create a receiver operating characteristic curve, and calculate analysis of variance for each cytokine.

