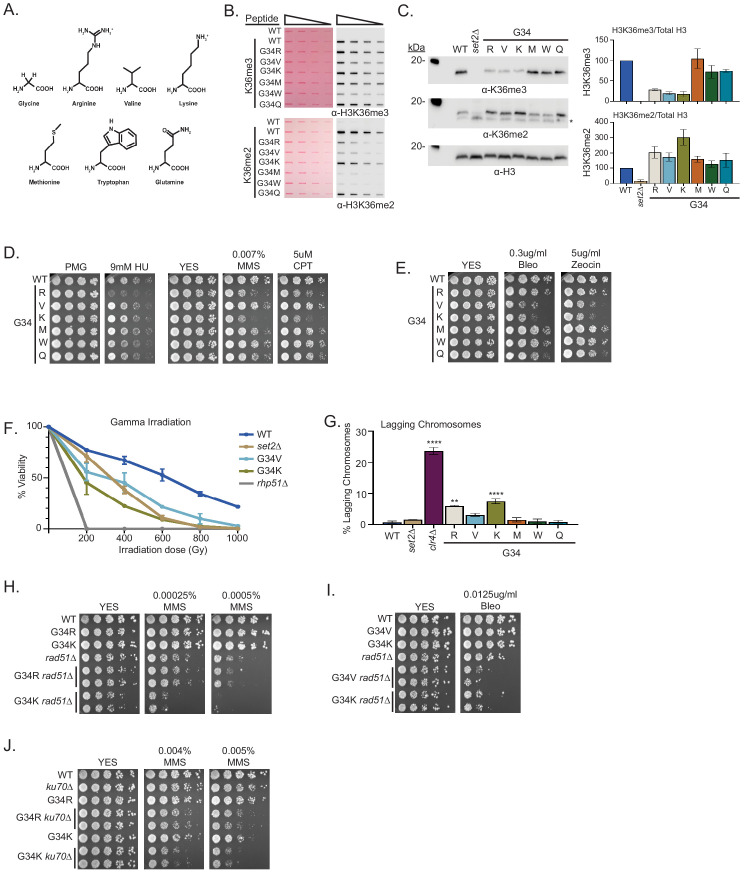
Figure 3. A panel of mutants at H3-G34 exhibit distinct effects on H3K36 methylation and different DNA-damage sensitivities.
(A) Structure of glycine and amino acid substitutions used in experiments. (B) Dot blot analysis to quantitatively assess recognition of WT, H3-G34R, V, K, M, W, or Q peptides bearing K36me2 or K36me3 modifications by anti-K36 methyl antibodies. Peptides were loaded in twofold serial dilutions and Ponceau staining was used as the loading control (left). (C) Western blot analysis of H3K36me3, K36me2, and total H3 in set2Δ, H3-WT, H3-G34R, V, K, M, W, and Q chromatin-fractionated cellular extracts (left). The * symbol represents a non-specific band in the H3K36me2 western. Quantification of K36 methylation levels relative to total H3 were calculated from two biological replicates (right). (D) Serial dilution yeast growth assay showing the effect of hydroxyurea (HU), methyl methanesulfonate (MMS), and camptothecin (CPT) on the indicated strains. (E) Serial dilution growth assay showing the effect of bleomycin and zeocin, two irradiation (IR) mimetics, on the indicated strains. (F) Effect of γ-IR exposure on viability of H3-WT, H3-G34R, H3-G34V, H3-G34K, set2Δ, and rad51Δ cells. Data represent mean ± SEM from eight biological replicates. (G) IF analysis of lagging chromosomes in the indicated strains from three independent experiments. % lagging chromosomes represents the percentage of lagging chromosomes in anaphase cells counted. Over 200 anaphase cells were counted for each strain. ** represents significant difference of p<0.001 and **** a significant difference of p<0.0001 with H3-WT strain. (H) Serial dilution growth assay testing epistasis of H3G34R and H3G34K with HR pathway mutant rad51Δ cells. (I) Serial dilution growth assay testing epistasis of H3-G34V with rad51Δ HR-deficient cells. (J) Serial dilution growth assay testing epistasis of H3-G34R and H3-G34K with ku70Δ NHEJ-deficient cells.

