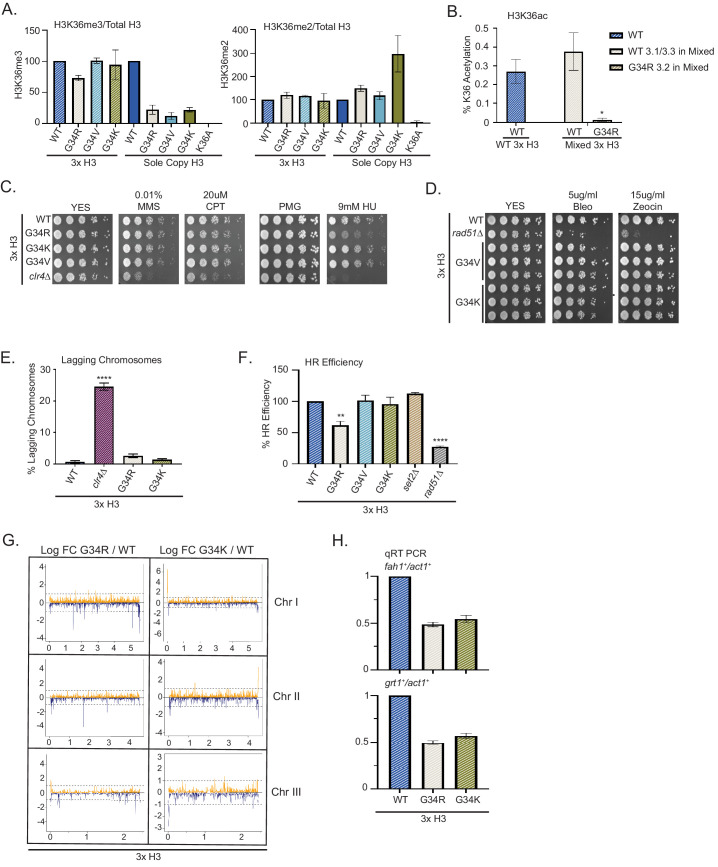
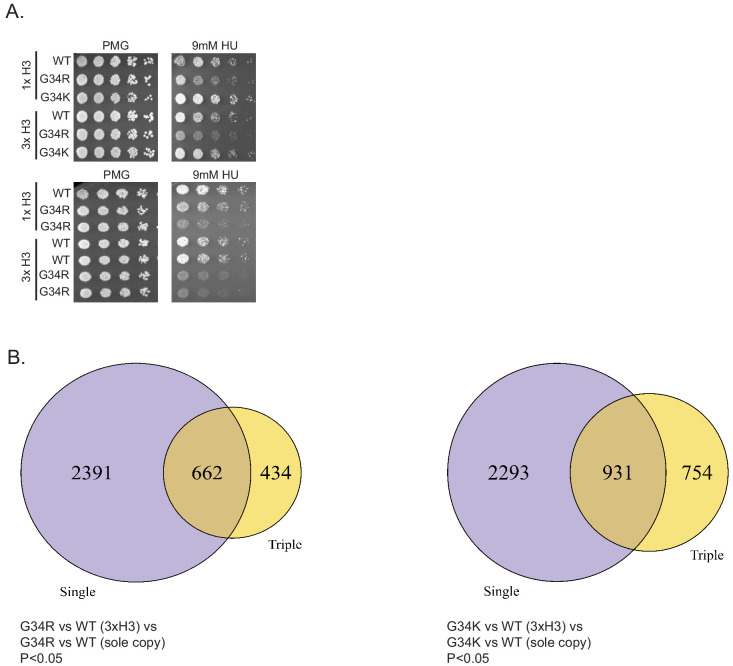
Figure 6. Dominance of hydroxyurea (HU) sensitivity, homologous recombination (HR) defects and subtelomeric silencing in strains co-expressing H3-G34R and WT H3.
(A) Western blot quantification of H3K36me2 and H3K36me3 normalized to total H3 in H3-WT, H3-G34R, H3-G34V, and H3-G34K chromatin extracts in both mixed H3 backgrounds (H3.1/H3.3 WT and H3.2 mutant) and sole copy H3 backgrounds. H3K36me2 and H3K36me3 methylation levels relative to total H3 were calculated from two biological replicates. (B) Mass spectrometry-based quantification of acetylation of H3K36 on histones purified from H3-WT (3xH3) and H3-G34R (mixed 3xH3 background) from four biological replicates. (C) Fivefold serial dilution growth assays showing the effect of HU, methyl methanesulfonate, and camptothecin on the indicated 3xH3 strains. (D) Serial dilution growth assay showing the bleomycin and zeocin sensitivity of H3-WT, rad51Δ, H3-G34V, and H3G34K 3xH3 cells. (E) Frequency of late anaphase cells that show a lagging chromosome in 3xH3 strains: WT, clr4Δ, H3-G34R, and H3-G34K. Mean ± SEM from four to eight replicates. **** represents a significance of p<0.0001 with the H3-WT strain. (F) HR assay based on correction of leu1-32 mutation by HR as shown in Figure 2—figure supplement 1. Relative HR efficiency is shown as 100% for H3-WT (3xH3), and results are averaged from three independent experiments with error bars representing SEM. ** p<0.005 and **** p<0.0001 reflect significant differences with H3-WT cells. (G) RNA-seq profiles for chromosomes I, II, and III comparing Logfold change ratios for H3-G34R/H3-WT and H3-G34K/H3-WT plotted against chromosome coordinates. Three biological replicates used for each strain, and all strains contain three copies of H3. (H) qRT-PCR validation of fah1+ and grt1+ expression relative to adh1+ expression from two independent biological replicates. Samples were normalized to the WT-H3 strain and shown as the mean ± SEM. Subtelomeric transcripts in H3-G34R and H3G34K cells (3xH3) are reduced when compared with WT.


