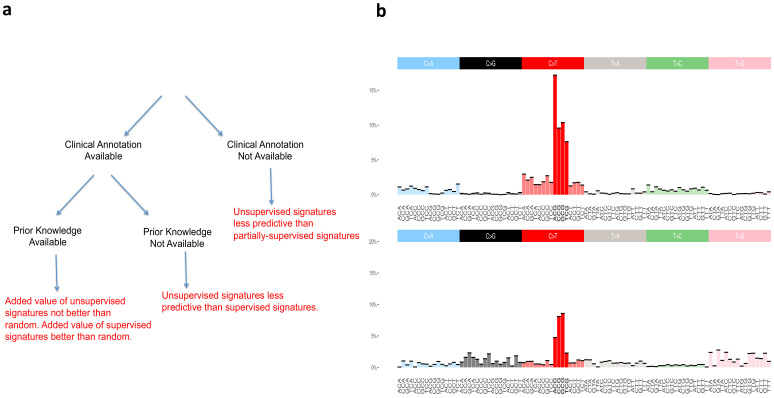
Figure 2. Supervised and unsupervised approaches to mutational signatures.
(a) The three possible scenarios in which the supervised and unsupervised approaches can be compared (black) and a summary of each comparison (red). (b) Unsupervised versus random. The signature at the top of the figure is the unsupervised ‘aging’ Signature one from Alexandrov et al., 2013b. We want to assess the value of this signature beyond the ‘peak’ at [C>T]G (bold red color), that is we want to evaluate how valuable is the rest of the distribution (colors not in bold) as found by the unsupervised method. The signature at the bottom of the figure is an example of randomly generated single peak signatures based on sampling from a uniform distribution. Note that the normalized frequency of the mutation type corresponding to the peak of this randomly generated signature is not a fixed value; it happens to carry by chance the highest weight of the distribution over [C>T]G (bold red color) mutations among a set of 30 signatures generated randomly (see Materials and methods section for their construction).

