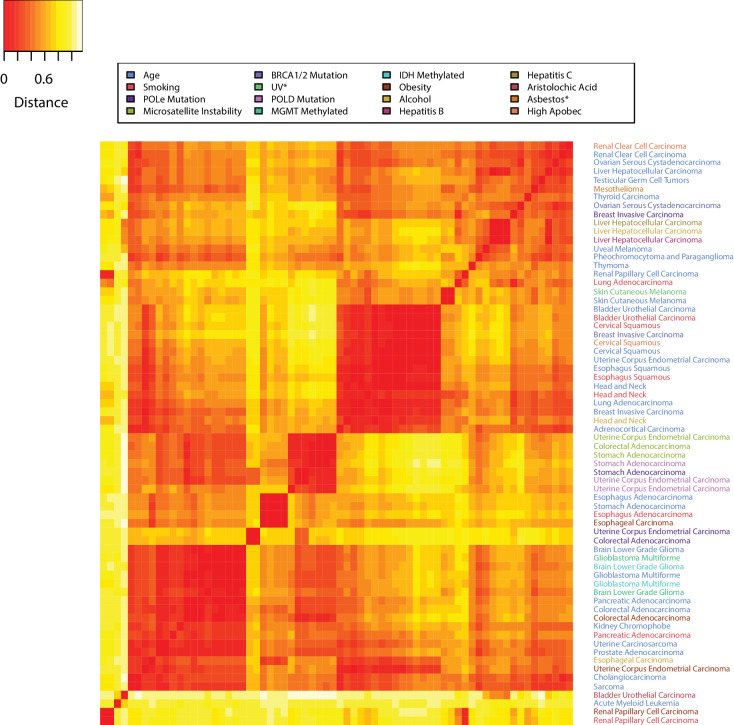
Figure 5. The tissue dependence of mutational signatures.
Heat map of the distances among mutational landscapes of different etiological factors for different tissues. Pearson’s correlation was used to calculate the distance (see Materials and methods). The lower the distance the more similar the corresponding mutational landscapes are.

