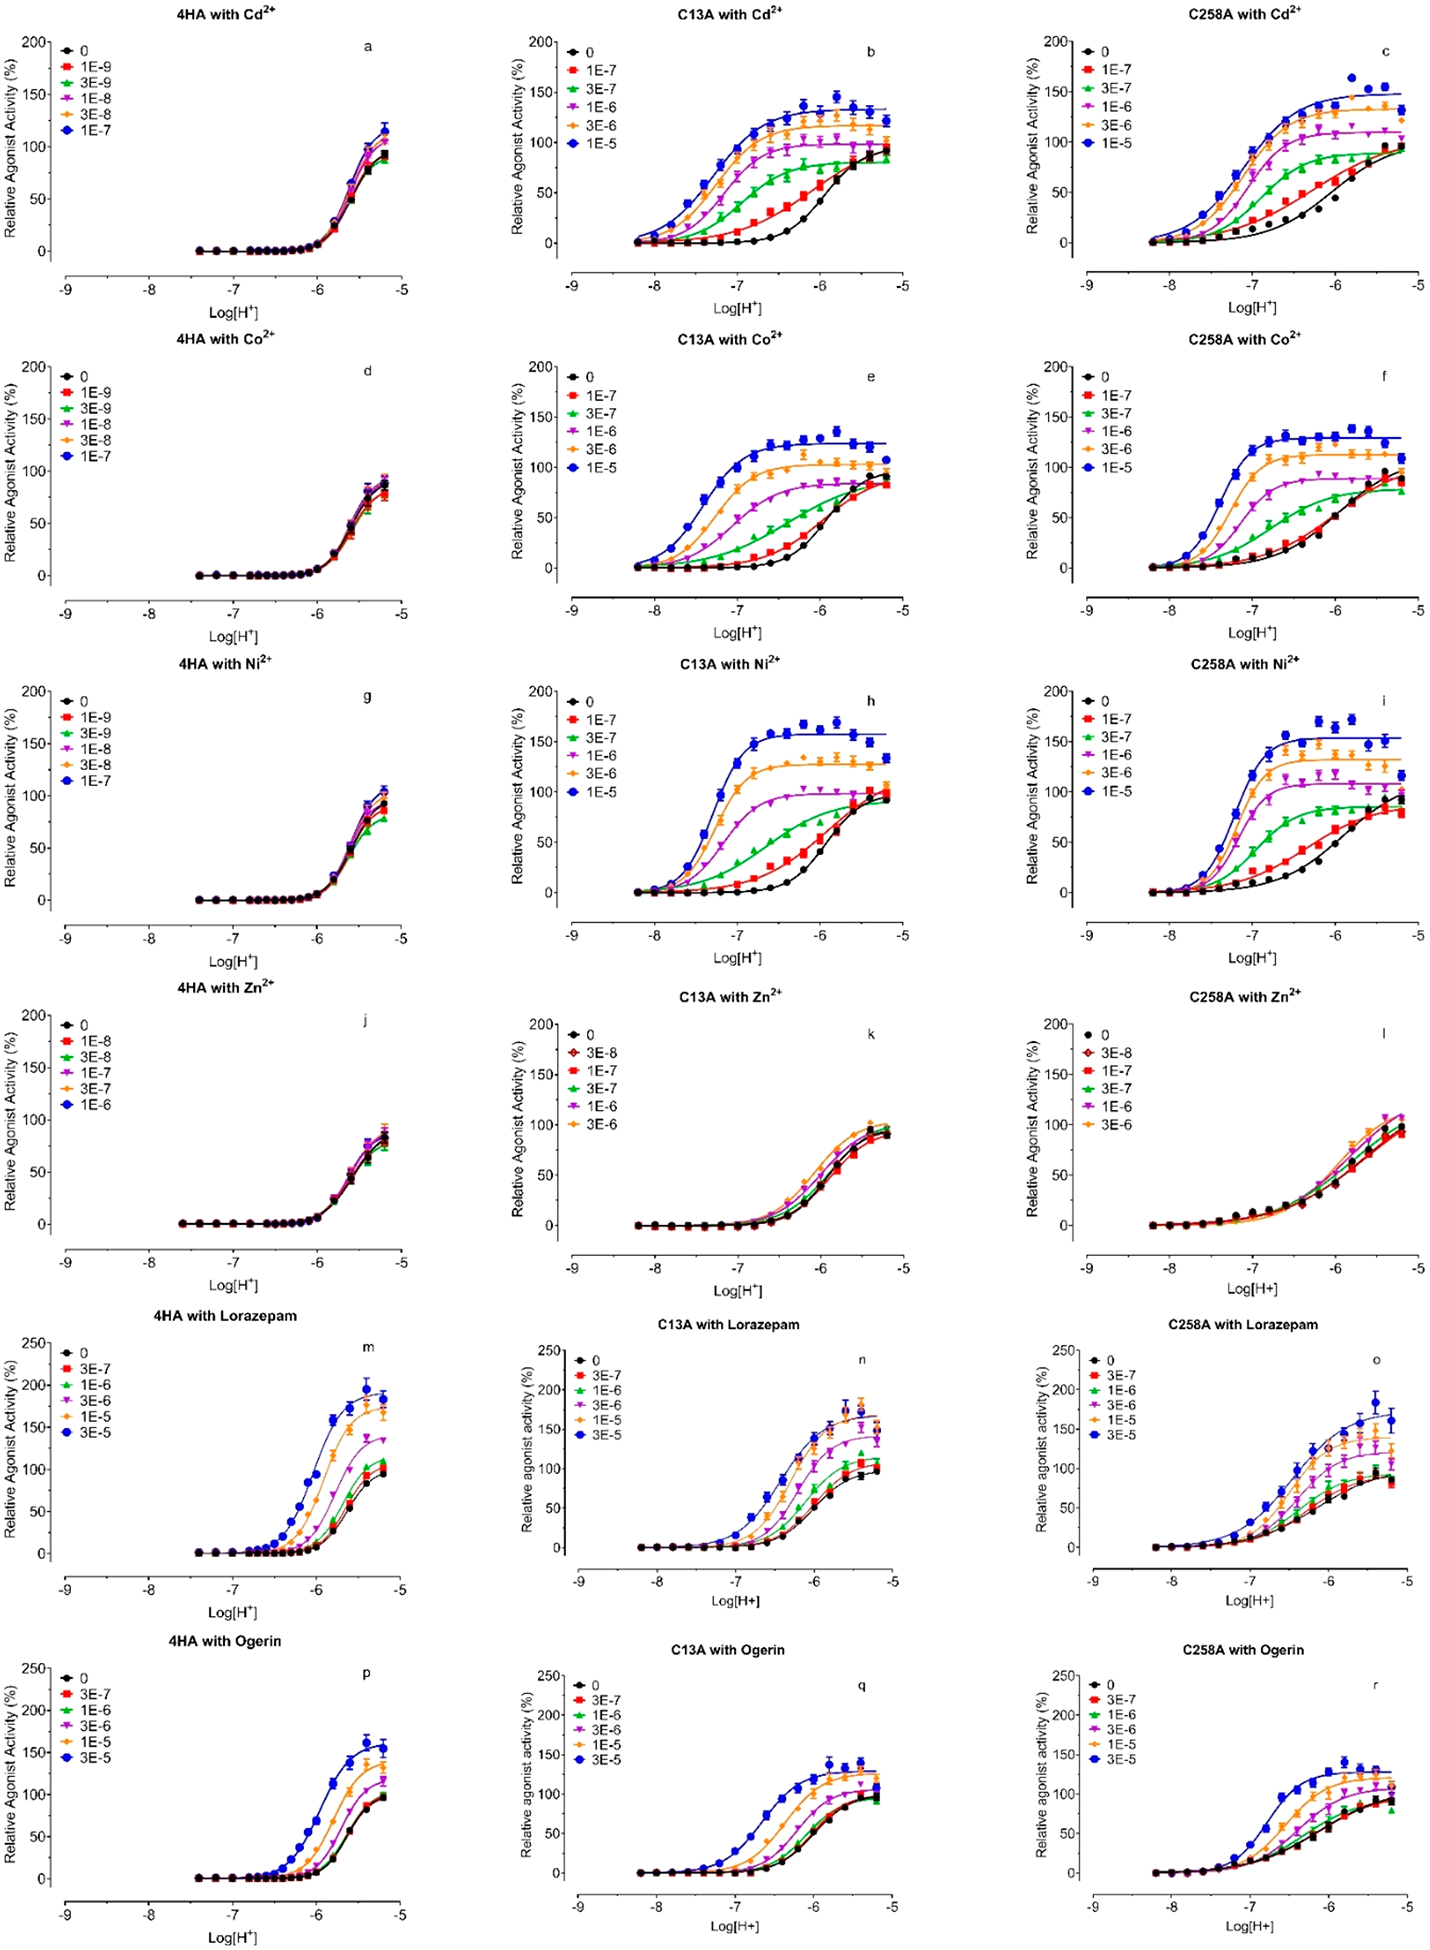
Figure 10.

Proton concentration-responses at GPR68 4HA (a, d, g, j, m, and p), C13A (b, e, h, k, n, and q), and C258A (c, f, i, l, o, and r) mutants in the absence and presence of increasing concentrations of Cd2+ (a, d, and g), Co2+ (b, e, and h), Ni2+ (c, f, and I), Zn2+ (j, k, and l), lorazepam (m, n, and o), and ogerin (p, q, and r). Gs-cAMP production was measured in transiently transfected HEK293T cells using the GloSensor cAMP assays. Metal ion stock solutions were made in water. Lorazepam and ogerin stock solutions were made in DMSO and diluted in pH preadjusted Ca2+/Mg2+ free HBSS-based buffers. Results were normalized to proton responses (%) and represented means ± SEM from a minimum of 3 independent assays, each in quadruplicate. Curves were analyzed in Prism 8 using the built-in four-parameter logistic function. The data were also analyzed using the standard allosteric operation model in Prism, and allosteric parameters were listed in Table 3.
