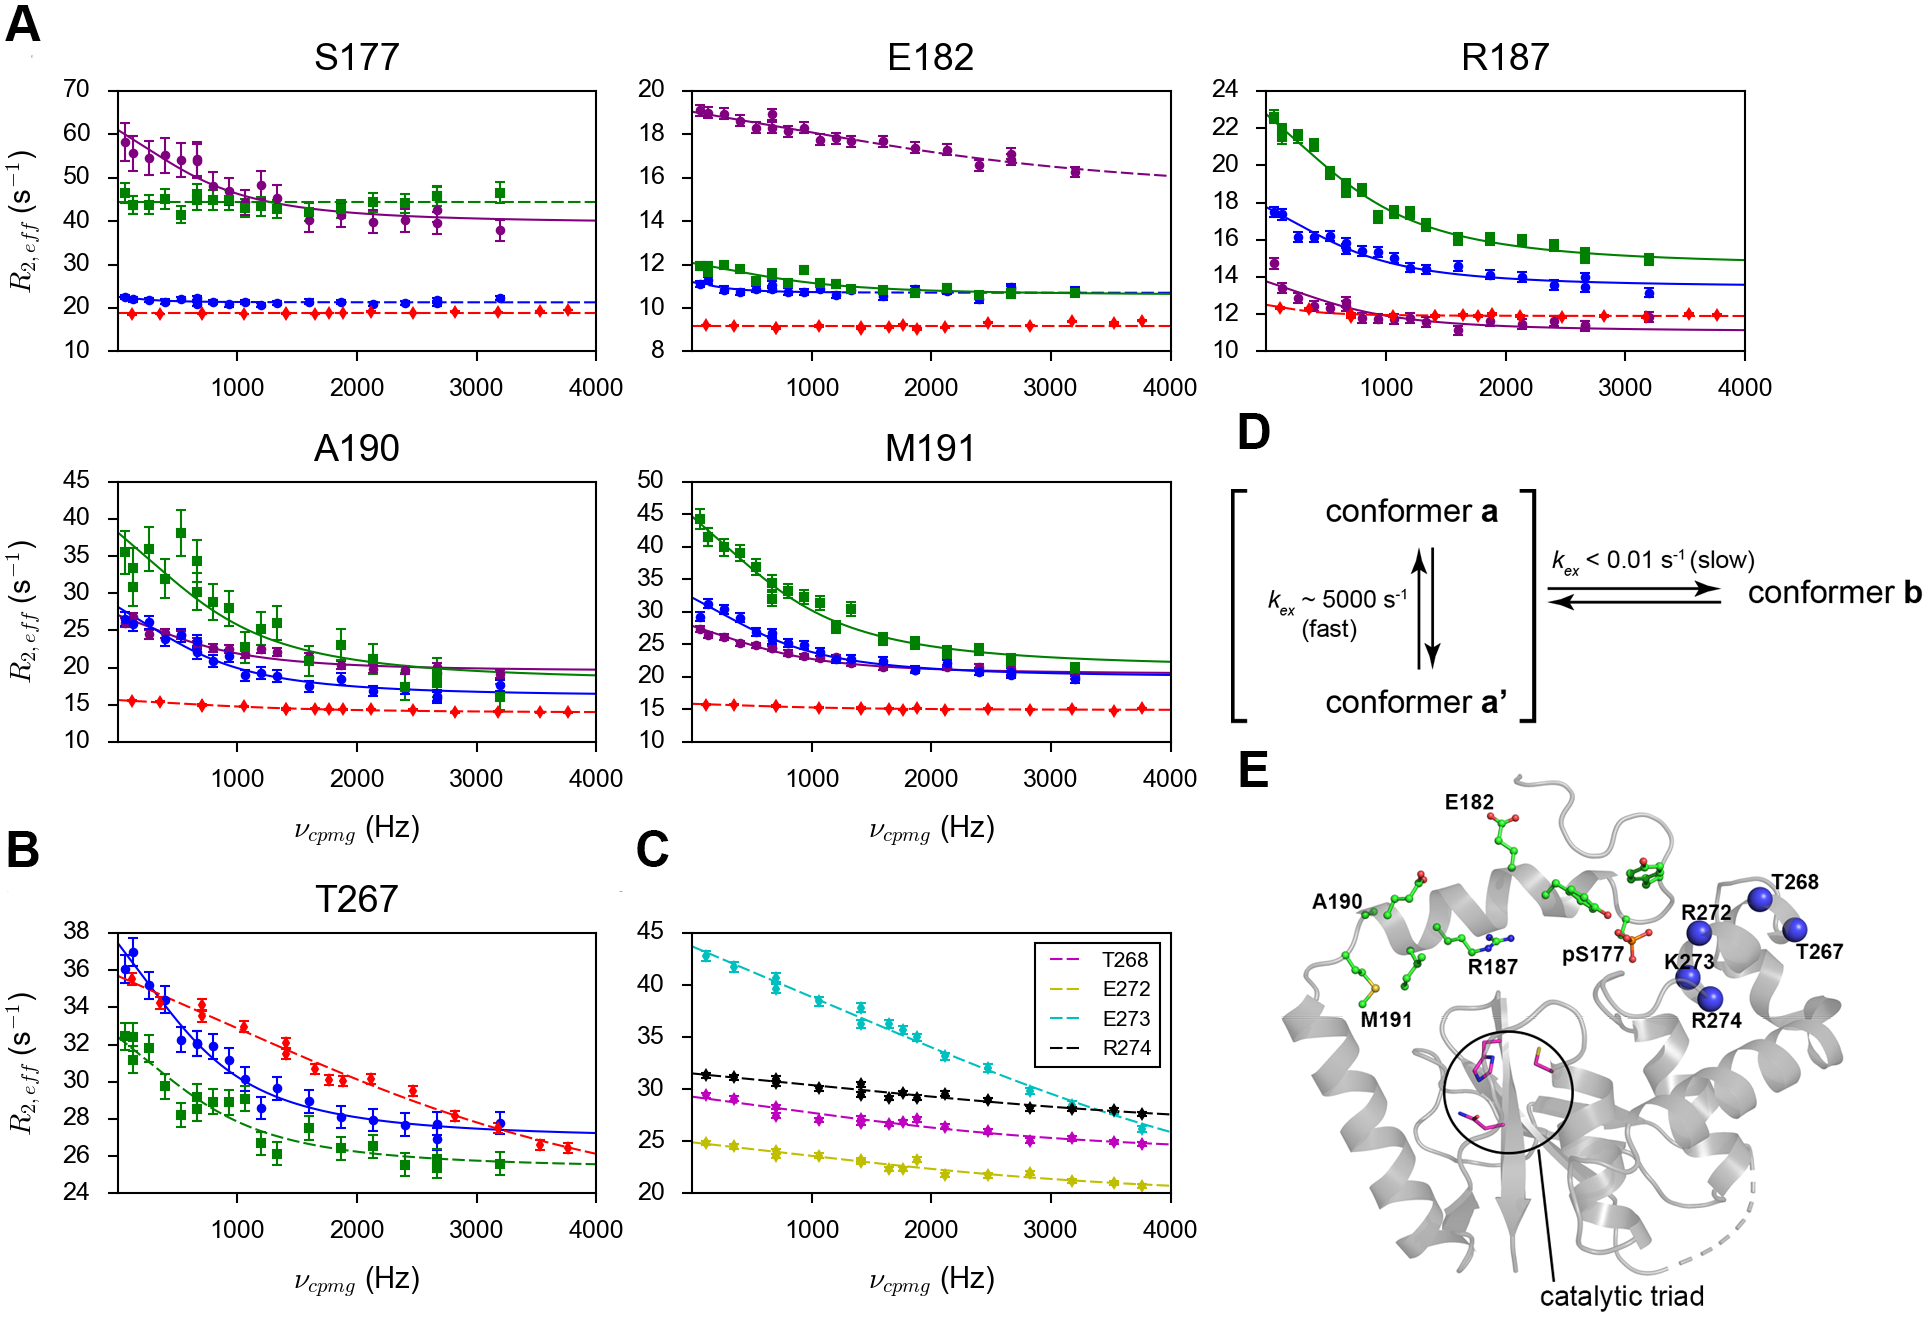
Figure 2.

The amide 1H relaxation dispersion profiles of (A) selected residues in the α1 helix and neighboring disordered regions and (B) T267 from the α6 helix in p-DUBA (a conformer in purple; b conformer or the only conformer in blue), np-DUBA (green) and p-R272E/K273E mutant (red). (C) The amide 1H relaxation dispersion profiles of other residues in the α6 helix, visible only in the p-R272E/K273E mutant. The solid lines represent group fits and the dashed lines represent individual fits. The uncertainty of R2,eff was determined according to noise. (D) The scheme illustrating the conformational processes of pS177 in the wild-type p-DUBA. (E) Crystal structure of p-DUBA (PDB code: 3TMP) with residues showing two conformers in solution highlighted by the stick-and-ball representation. Blue spheres represent residues in the α6 helix on which CPMG data can be obtained for either the wild-type p-DUBA or the p-R272E/K273E mutant.
