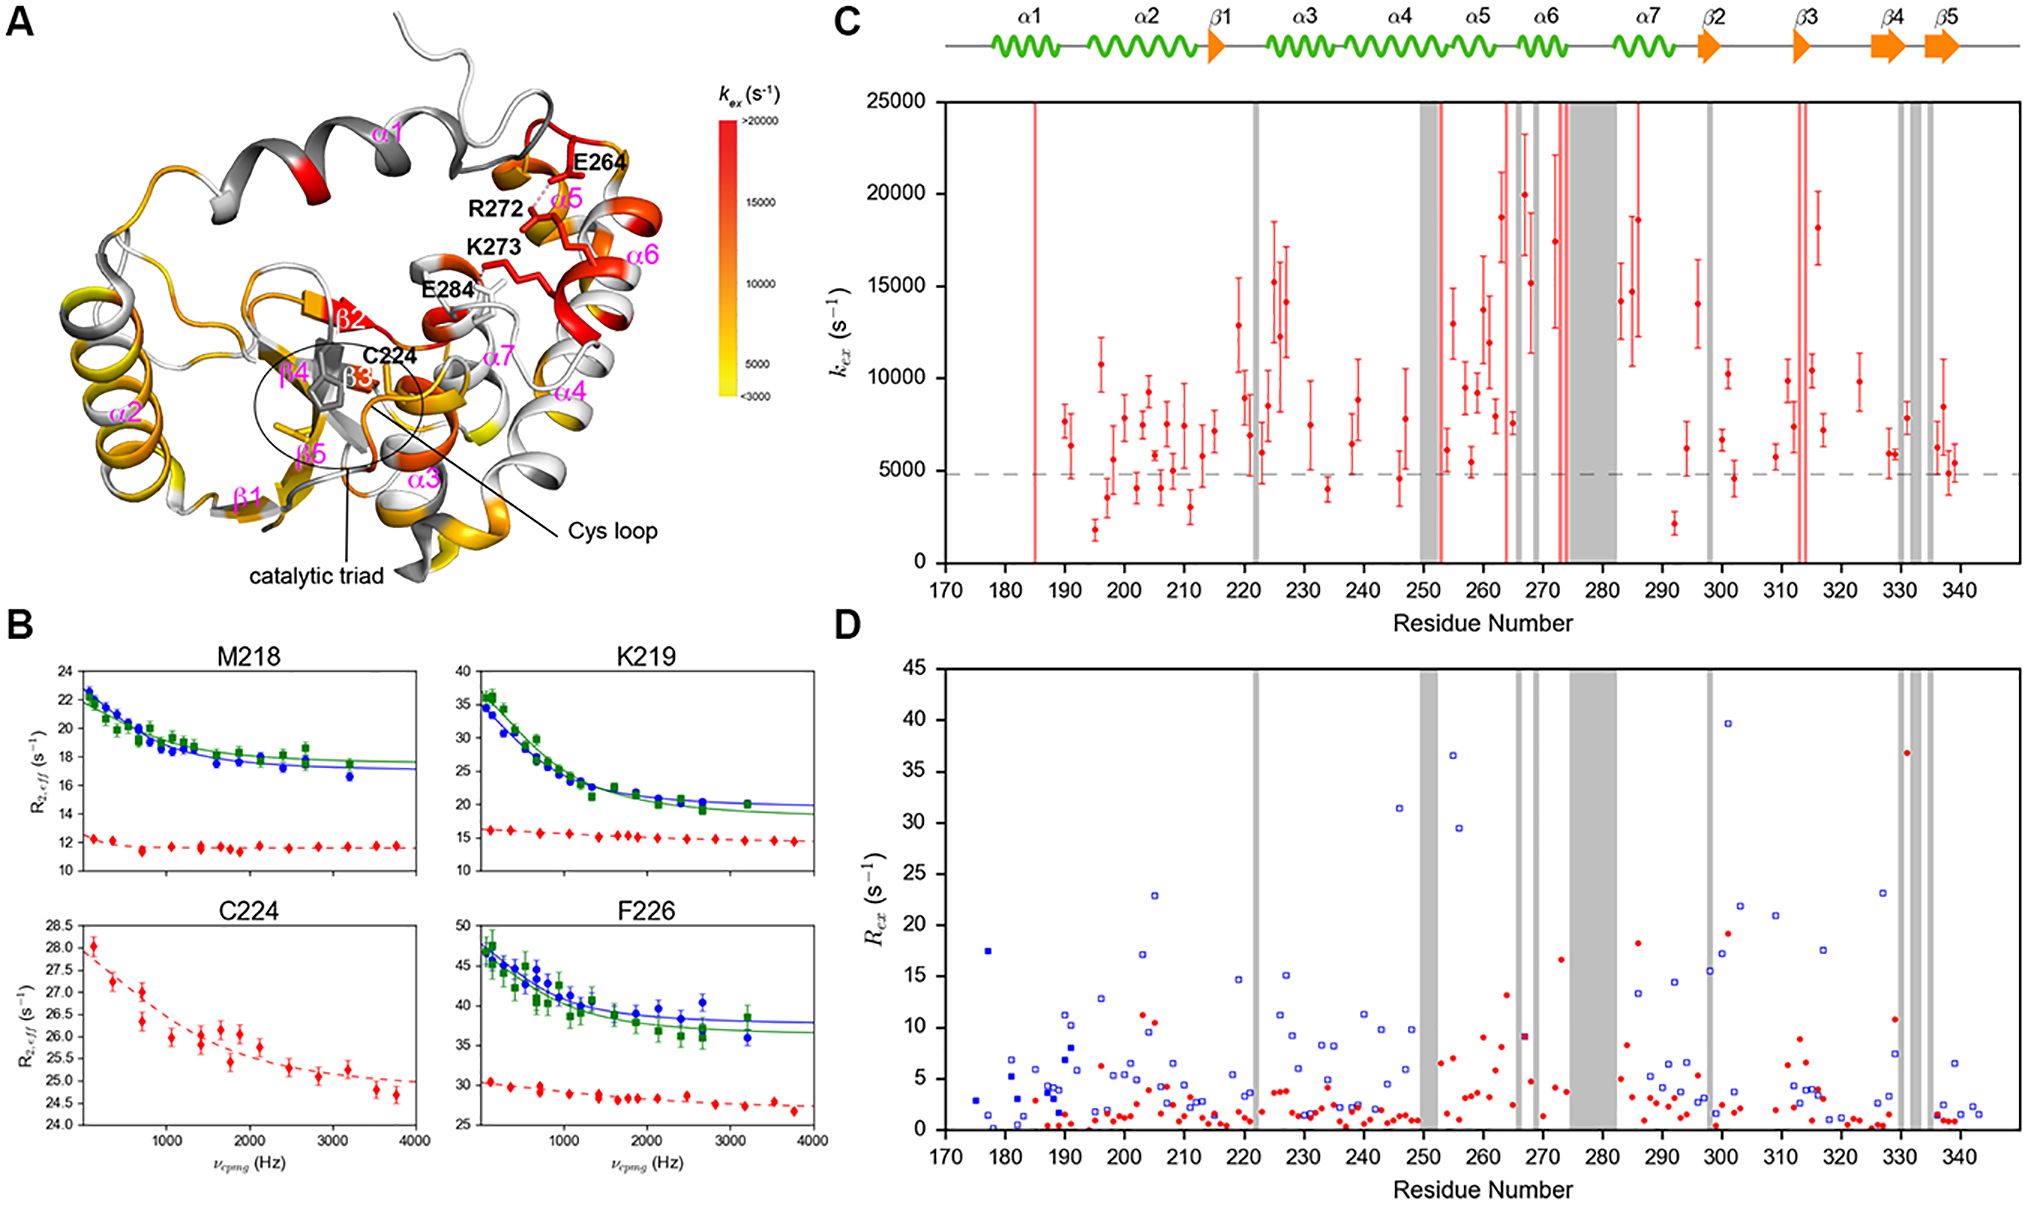
Figure 3.

(A) kex of 68 residues in p-R272E/K273E mutant mapped to the crystal structure of p-DUBA (PDB code: 3TMP). Dark grey represents residues without conformational exchange. White color represents residues that cannot be assigned or detected, not completely resolved or display higher than 35% uncertainty in kex. Dash lines represent salt bridges. (B) Selected amide 1H relaxation dispersion profiles of residues in the Cys loop and the α3 helix of p-DUBA (blue), np-DUBA (green) and p-R272E/K273E (red). The solid lines represent group fits and the dashed lines represent individual fits. (C) kex of p-R272E/K273E plotted as a function of residue number. The dashed line represents the exchange rate of p-DUBA, 4954 s−1. (D) Rex of wild-type p-DUBA (blue) and p-R272E/K273E mutant (red). For p-DUBA, Rex was estimated from the difference in R2,eff at νCPMG = 66.7 Hz and 3200 Hz; for p-R272E/K273E mutant, Rex was estimated from the difference in R2,eff at νCPMG = 117.6 Hz and 3764.7 Hz. In both (C) and (D), the regions shaded in grey represent residues without detectable NMR signals in the p-R272E/K273E mutant due to line broadening induced by conformational exchange.
