
Figure 4.
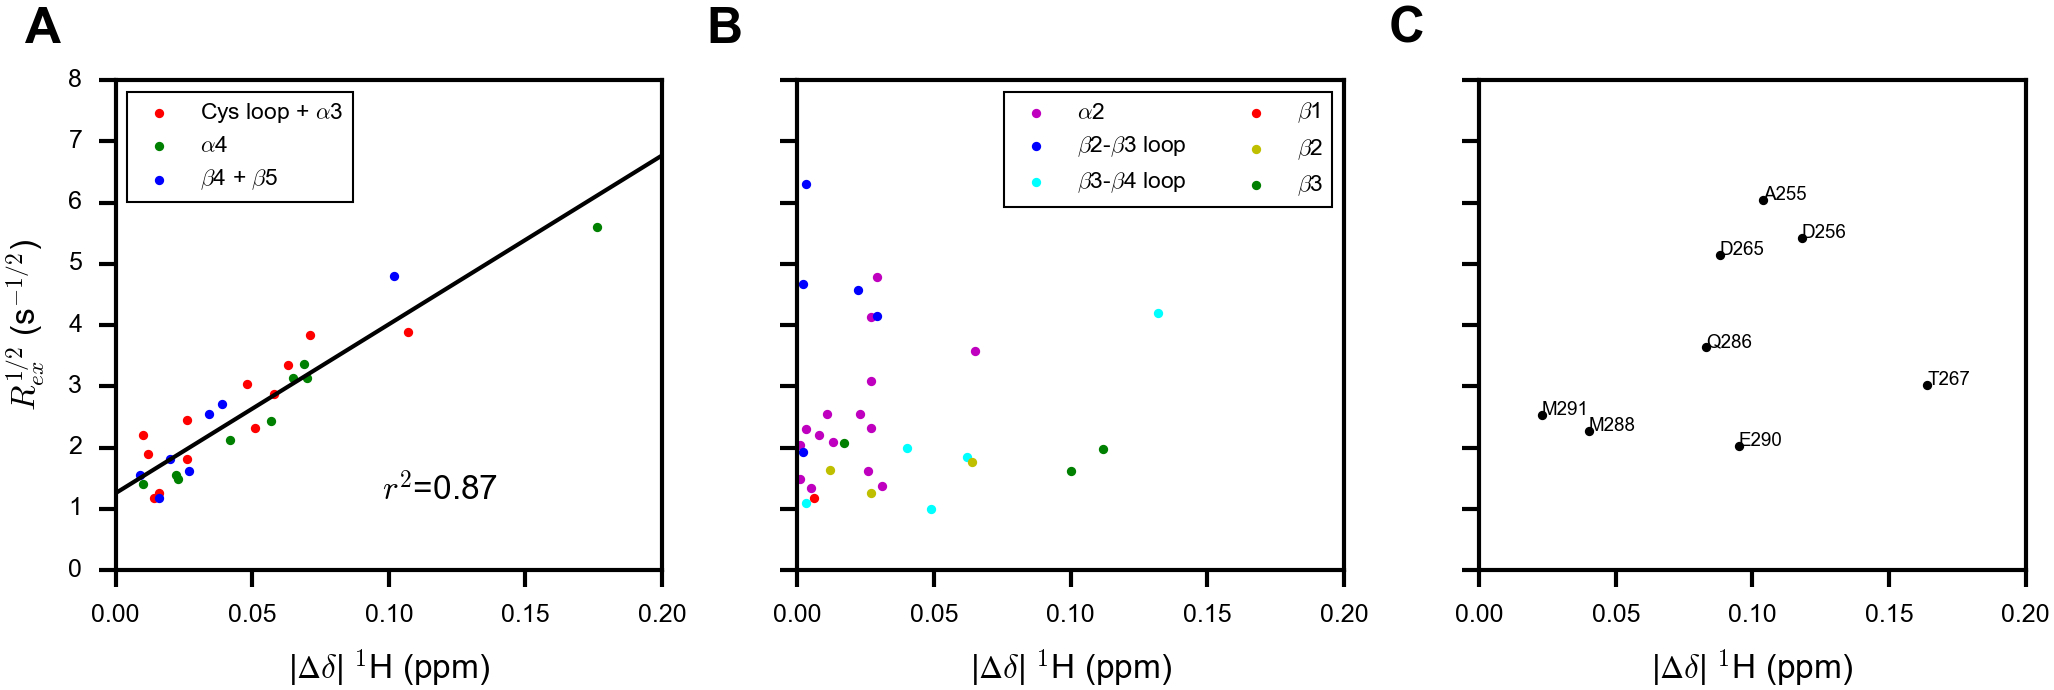
Correlation plots of Rex1/2 from the wild-type p-DUBA versus the absolute value of the amide 1H chemical shift difference between the wild-type p-DUBA and the p-R272E/K273E mutant (|Δδ| 1H) for (A) residues showing good correlations, (B) residues showing poor correlations, and (C) residues located in the α5-α7 helices, which are mostly not visible in the 15N TROSY spectrum of wild-type p-DUBA.