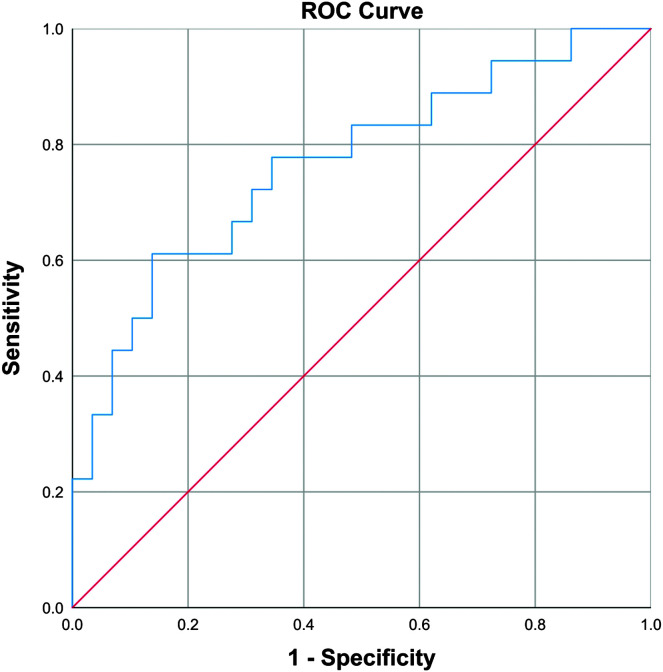
Figure 2.
Receiver operating characteristic (ROC) curve of the weighted stuttering-like disfluency (blue line) to discriminate eventual stuttering recovery and persistence. True positive rate or sensitivity is plotted along the y-axis against false positive rate or 1 − specificity on the x-axis. The 45° red diagonal line serves as a null reference denoting no discrimination.

