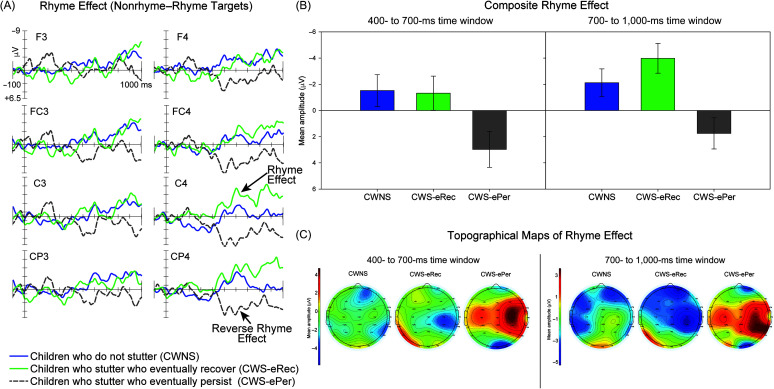
Figure 5.
(A) Rhyme effects elicited by targets for children who do not stutter (CWNS), children who eventually recovered from stuttering (CWS-eRec), and children who eventually persisted in stuttering (CWS-ePer) are illustrated for the midlateral electrode sites included in analyses. CWNS and CWS-eRec exhibited the expected rhyme effect, with larger amplitudes elicited by nonrhyme targets compared to rhyme targets. In contrast, CWS-ePer exhibited a reverse rhyme effect, with larger amplitudes elicited by rhyme targets compared to nonrhyme targets. (B) Composite rhyme effect values, calculated as the mean across midlateral electrodes included in analyses (illustrated in Panel A), are plotted for the two analysis time windows. (C) Topographical head plots show the distribution of the rhyme effect across the scalp for each group for each time window. Cooler colors (blue) indicate more negative mean amplitudes, and warmer colors (red) indicate more positive mean amplitudes.

