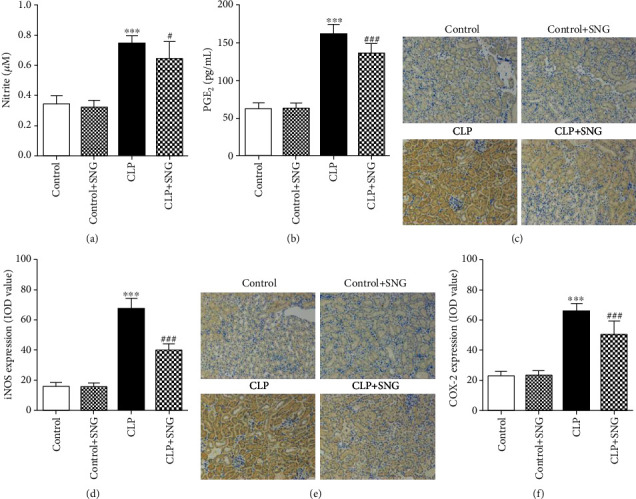
Figure 3.

Effect of SNG pretreatment on the productions of NO and PGE2 and the expressions of iNOS and COX-2. The productions of (a) NO and (b) PGE2 in different groups; the effect of SNG on the expressions of (c, d) iNOS and (e, f) COX-2 (×200). SNG: s-nitrosoglutathione; NO: nitric oxide; PGE2: prostaglandin E2; iNOS: inducible nitric oxide synthases; COX-2: cyclooxygenase-2. Data are expressed as mean ± SD. ∗∗∗P < 0.001 vs. the control group; #P < 0.05 and ###P < 0.001 vs. the CLP group (n = 10 in each group).
