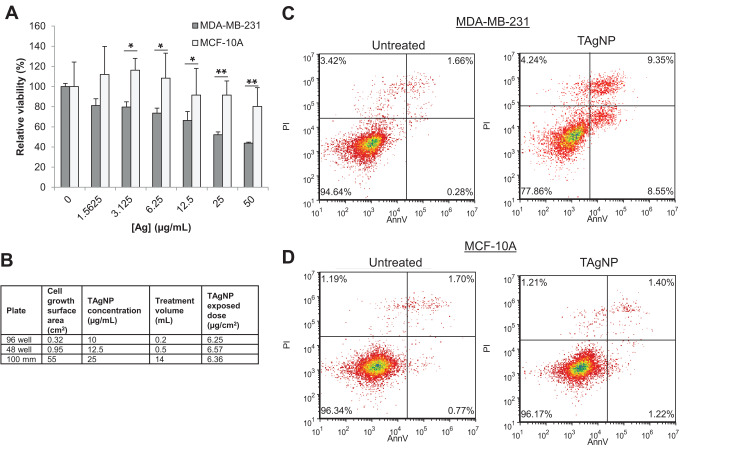
Figure 2.
TAgNPs are more cytotoxic to TNBC than to non-malignant mammary epithelial cells. (A) Relative viability of MCF-10A and MDA-MB-231 after 72-hour treatment with TAgNPs (0–50 µg/mL). Viability was assessed by MTT assay. Data is representative of at least 3 independent experiments. Statistical analysis was performed by two-way ANOVA followed by post hoc Tukey’s test. Statistical differences are indicated (*p<0.05; **p<0.01). (B) The dose per unit area in comparison to the concentration of TAgNPs was calculated for various well sizes and is shown in tabular form. (C) MDA-MB-231 and (D) MCF-10A cells were treated with 12.5 µg/mL TAgNPs for 24 hours. Cells were co-stained with propidium iodide (PI) and annexin V (AnnV), and then evaluated by flow cytometry. The percentages of cells characterized as viable (lower-left quadrant), early apoptotic (lower-right quadrant), late apoptotic (upper-right quadrant) and necrotic (upper-left quadrant) are shown with each quadrant. The presented data are representative of duplicate independent experiments.

