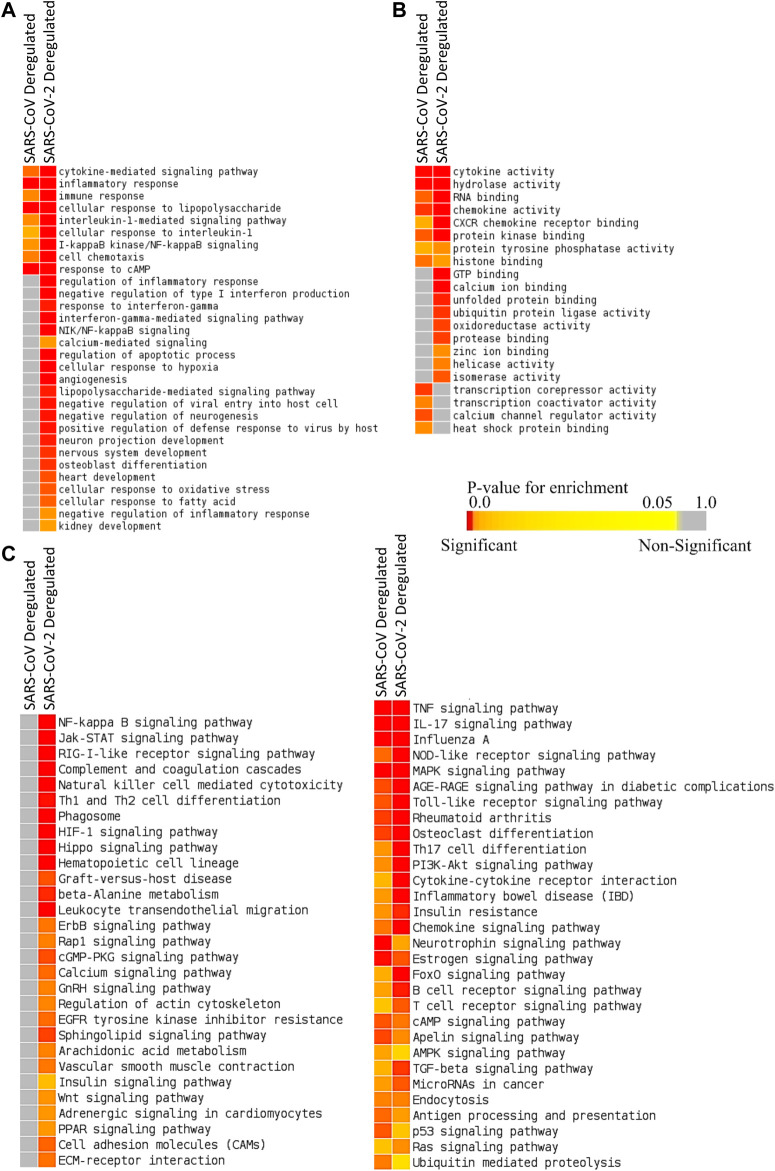
Figure 2.
Enrichment analysis and comparison between deregulated genes in SARS-CoV and SARS-CoV-2 infections using (A) GOBP module, (B) GOMF module, and (C) KEGG pathway module. The significance of enrichment in terms of the adjusted p value (<0.05) is represented in color-coded p value scale for all heatmaps. Color toward red indicates higher significance and color toward yellow indicates less significance, while gray means nonsignificant.

