FIGURE 3.
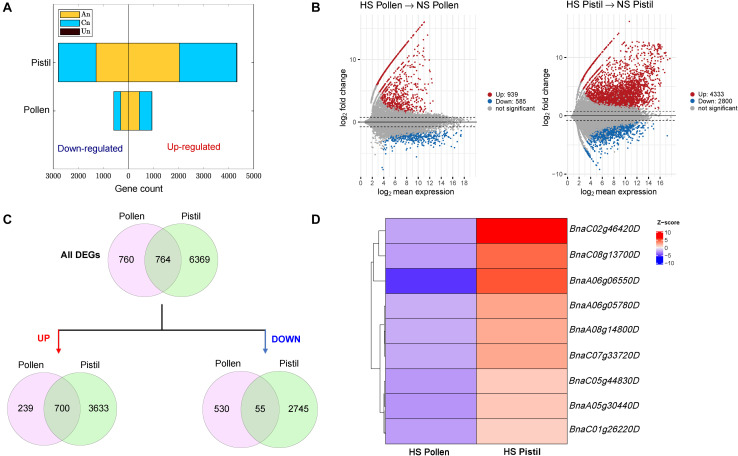
Differential gene expression analysis. (A) Number of up and down-regulated gene in heat-stressed pollen and pistil and their distribution on the An and Cn subgenome (Un represents genes located on uncertain chromosomes. (B) MA Plot of the differentially expressed genes in heat-stressed pollen and pistil; red dots represent upregulated genes, blue dot represent downregulated genes; and gray dots represent non-significant genes. HS, heat stressed; NS, non-stressed. (C) Venn diagrams showing all shared DEGs, only upregulated shared DEGs and only down-regulated shared DEGs between heat-stressed pollen and pistil. (D) Details and expression levels of the shared DEGs with upregulated expression in heat-stressed pistil and downregulated expression in heat-stressed pollen.

